Property Report: $890800 NDIS Bookfield RENTAL
Property Report :
$890800 NDIS Bookfield
Lot 321 Sumac St. Everton Estate, Brookfield, 3338

Powered by
Real Estate Analysis
![]()
Created on: Apr 14, 2025
Author: NDIS SUPPORT
Company: NDIS Property
Executive Summary
Lot 321 Sumac St. Everton Estate, Brookfield, 3338
Commercial (Special-Purpose): 3 rooms: 3 bedrooms , 3 bathrooms
Year built: 2023, Size: 207 SM
Investment strategy: Rental Property
The information presented in this presentation regarding the rental potential of National Disability Insurance Scheme (NDIS) Specialist Disability Accommodation (SDA) is intended for informational purposes only and should not be construed as financial, legal, or investment advice. Investment in NDIS SDA properties carries inherent risks, and individual circumstances can greatly impact rental potential. We strongly advise consulting with qualified professionals, including financial advisors, legal experts, and real estate professionals, to assess the suitability of NDIS SDA investments for your specific situation. We disclaim any responsibility for decisions made based on the information provided in this presentation.

Financial Analysis
| Cash on Cash Return | 64.92 % |
| Internal Rate of Return (IRR) | 67.50 % |
| Capitalization Rate | 18.60 % |
| Gross Rent Multiplier (GRM) | 4.56 |
| Debt-coverage Ratio (DCR) | 2.24 |
| Operating Expense Ratio (OER) | 10.66 % |
Financial Breakdown
| Purchase Price | $ 890,800 |
| Purchase Costs | $ 52,349 |
| Repair/Construction Costs | $ 0 |
| $ 943,149 | |
| Financing | $ 801,720 |
| $ 141,429 | |
| $ 89,080 | |
| $ 52,349 |
Operating Analysis
| Rent | $ 16,268/mo |
| Gross Operating Income (GOI) | $ 185,455 |
| Total Expenses | $ 19,768 |
| Net Operating Income (NOI) | $ 165,687 |
| Annual Debt Service | $ 73,872 |
| Cash Flow Before Taxes (CFBT) | $ 91,815 |
| Income Tax Liability | $ 0 |
| Cash Flow After Taxes (CFAT) | $ 91,815 |
Property Description
Suitable for 2 SDA Participants with Overnight Carer Accommodation
| Purchase Price | $ 890,800 |
| Address | Lot 321 Sumac St. Everton Estate, Brookfield, 3338, AU |
| Year Built | 2023 |
| Type | Commercial |
| Category | Special-Purpose |
| Size | 207 SM |
| Bedrooms | 3 |
| Bathrooms | 3 |
| Rooms Total | 3 |

Operating Analysis
Financial Analysis
Financing Overview
Long-term Cash Flow Forecast
Resale Analysis
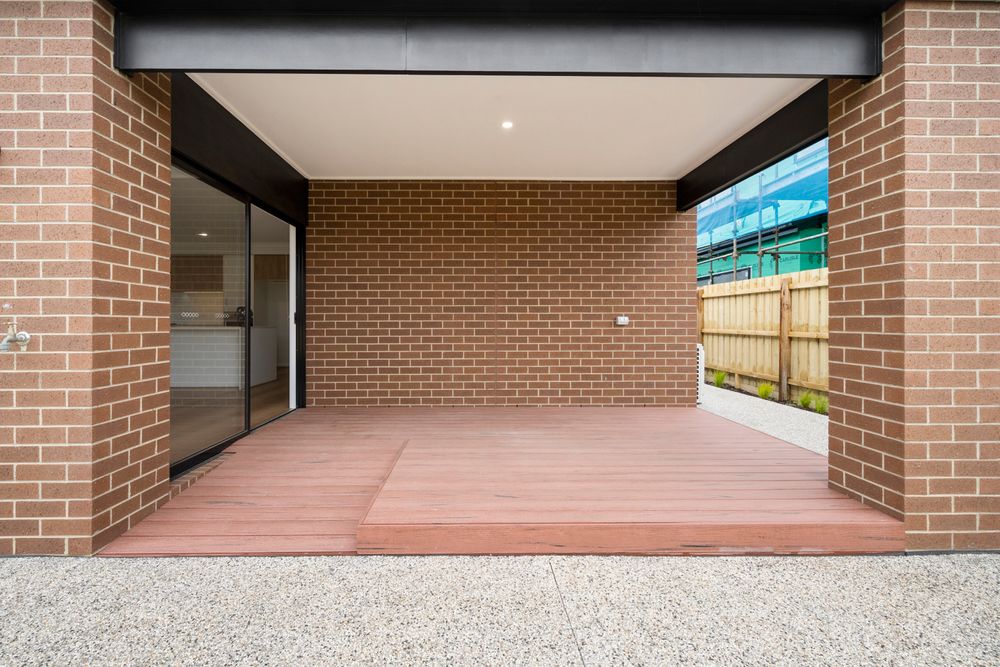
Photos


Sign in to edit this report, add or compare properties. Don't have an acount? Sign up now!