Vanessa Jordan, PA
12942 SW 133 CT STE B
MIAMI, FL 33186

Property Report: 8500 SW 133rd Ave Rd Apt 412, Miami RENTAL

Property Report :

8500 SW 133rd Ave Rd Apt 412, Miami, FL 33183

Created on: Apr 15, 2025

Author: Vanessa Jordan

Company: Vanessa Jordan, PA

8500 SW 133rd Ave Rd Apt 412, Miami, FL 33183

Condominium: 3 bedrooms , 2 bathrooms

Year built: 1981, Size: 1040 SF

Investment strategy: Rental Property

Purchase Price$ 223,500
Rent$ 2,675/mo
Monthly Cash Flow$ 631
Cash on Cash Return20.25 %

Financial Analysis

Cash on Cash Return 20.25 %
Internal Rate of Return (IRR) 25.76 %
Capitalization Rate 8.34 %
Gross Rent Multiplier (GRM) 6.96
Debt-coverage Ratio (DCR) 1.68
Operating Expense Ratio (OER) 37.54 %

Financial Breakdown

Purchase Price $ 223,500
Purchase Costs $ 12,023
Repair/Construction Costs $ 3,000
Total Capital Needed
$ 238,523
Financing $ 201,150
Total Cash Needed
$ 37,373
Cash at Closing
$ 26,373
Cash During Rehab
$ 11,000

Operating Analysis

Rent $ 2,675/mo
Gross Operating Income (GOI) $ 29,853
Total Expenses $ 11,208
Net Operating Income (NOI) $ 18,645
Annual Debt Service $ 11,076
Cash Flow Before Taxes (CFBT) $ 7,569
Income Tax Liability $ 1,203
Cash Flow After Taxes (CFAT) $ 6,365

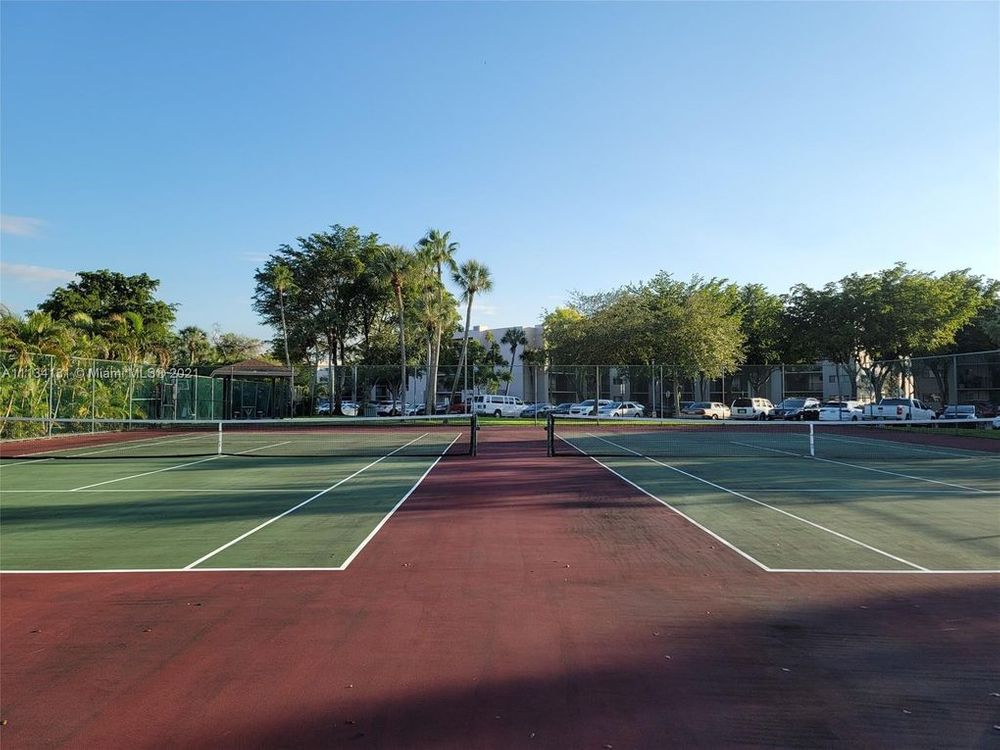
Corner unit apartment located on the 4th floor. It features 3 beds, 2 baths & a large balcony. This beautiful apartment is in Horizon West. Horizons West is a community located in the Kendall area of West Miami, Florida, it has been maintained and well cared for over the years, great landscaping with a picnic area and cabanas. The community has a gated entrance with a guard on duty, assigned parking, three pools, racquetball, tennis, and a clubhouse. Perfect Location on Kendall Drive near shopping centers, restaurants, movie theaters, and two minutes' drive to Turnpike expressway.

Purchase Price $ 223,500
Address 8500 SW 133rd Ave Rd Apt 412 , Miami, 33183, FL
MLS® # A11134131
Listing Agent Marco Torres
Listing Broker Miami Premier Realty
Year Built 1981
Type Condominium
Size 1040 SF
Bedrooms 3
Bathrooms 2
8500 SW 133rd Ave Rd Apt 412 Miami, FL 33183
  • Condominium

    Bldg type
  • 1,040

    SqFt
  • 3

    Beds
  • 2

    Baths
# Property address Distance Beds Baths SqFt Bldg type Date sold Sale price $/SqFt
1 8420 SW 133rd Avenue Rd Apt 406 0.1mi 3 2 1,040 condo 10/12/2021 $ 200,000 $ 192
2 8420 SW 133rd Avenue Rd Apt 218 0.1mi 3 2 1,040 condo 9/22/2021 $ 223,200 $ 215
3 8520 SW 133rd Avenue Rd Apt 214 0.1mi 3 2 1,040 condo 9/1/2021 $ 208,000 $ 200
4 8520 SW 133rd Avenue Rd Apt 112 0.1mi 3 2 1,040 condo 8/23/2021 $ 225,000 $ 216
5 8520 SW 133rd Ave Rd Apt 214 0.1mi 3 2 1,040 condo 8/24/2021 $ 208,000 $ 200
6 8540 SW 133rd Avenue Rd Apt 112 0.2mi 3 2 1,040 condo 11/5/2021 $ 215,000 $ 207
7 8600 SW 133rd Avenue Rd Apt 223 0.2mi 3 2 1,040 condo 11/11/2021 $ 205,000 $ 197
Average: $ 212,029 $ 204
8500 SW 133rd Ave Rd Apt 412 Miami, FL 33183
  • $ 2,675

    Rent
  • Condominium

    Bldg type
  • 1,040

    SqFt
  • 3

    Beds
  • 2

    Baths

Your rent may be too high.

Average

$ 2,204 

Median

$ 2,150

25th %

$ 1,958

75th %

$ 2,450

# Property address Similarity Distance Beds Baths SqFt Date Listed Bldg type Rent
1 8500 Sw 133rd Ave Rd, Apt 111
95%
0.0mi 3 2 1,040 11/2/2021 Condo $ 1,950
2 8500 Sw 133rd Ave Rd, Apt 118
95%
0.0mi 3 2 1,040 12/13/2021 Condo $ 2,500
3 8540 Sw 133rd Ave Rd, Apt 407
95%
0.2mi 3 2 1,040 1/13/2022 Condo $ 2,100
4 8600 Sw 133rd Avenue Rd, Apt 423
94%
0.3mi 3 2 1,040 2/3/2022 Condo $ 2,200
5 8700 Sw 133rd Avenue Rd, Apt 312
94%
0.4mi 3 2 1,040 11/15/2021 Condo $ 2,100

You can edit, sort, drag and reorder suggested comps below. Select the comps you want to include in the report. You can also add comps manually.

Property address Similarity Distance Beds Baths SqFt Date Listed Bldg type Rent Notes Edit
8500 Sw 133rd Ave Rd, Apt 111
95%
0.0mi 3 2 1,040 11/2/2021 Condo $ 1,950
8500 Sw 133rd Ave Rd, Apt 118
95%
0.0mi 3 2 1,040 12/13/2021 Condo $ 2,500
8540 Sw 133rd Ave Rd, Apt 407
95%
0.2mi 3 2 1,040 1/13/2022 Condo $ 2,100
8600 Sw 133rd Avenue Rd, Apt 423
94%
0.3mi 3 2 1,040 2/3/2022 Condo $ 2,200
8700 Sw 133rd Avenue Rd, Apt 312
94%
0.4mi 3 2 1,040 11/15/2021 Condo $ 2,100

Comps selected: 5

Annual Property Operating Data

Incomes % of GOI
Gross Scheduled Income
$ 32,100    
Total Gross Income $ 32,100  
Vacancy loss
$ 2,247  
Gross Operating Income
$ 29,853 100.00 %
Expenses
Property tax $ 3,000 10.05 %
Association fees $ 7,200 24.12 %
Insurance $ 1,008 3.38 %
Total Expenses $ 11,208 37.54 %
Net Operating Income
$ 18,645 62.46 %
JavaScript chart by amCharts 3.20.13

Cash Flow (Year 1)

Net Operating Income $ 18,645 62.46 %
Annual Debt Service $ 11,076 37.10 %
Cash Flow Before Taxes (CFBT)
$ 7,569 25.35 %
Income Tax Liability $ 1,203 4.03 %
Cash Flow After Taxes (CFAT)
$ 6,365 21.32 %

Operating Ratios

Operating Expense Ratio
37.54 %
Break-Even Ratio
74.65 %

Financial Measures

Net Present Value
$ 97,004
Internal Rate of Return
25.76 %
Profitability Index
3.60
Annual Depreciation $ 6,502

Holding period of 10 years and discount rate of 5.00% were used for calculation of NPV and IRR. The rest of the financial measures are for the 1st year only and therefore don't provide such an exact information.

Investment Return Ratios

Cash on Cash Return
20.25 %
Return on Investment
38.19 %
Capitalization Rate
8.34 %
Gross Rental Yield
14.36 %
Gross Rent Multiplier
6.96
Financing
Down Payment $ 22,350
LOAN $ 201,150
Loan to Value Ratio
90.00 %
Loan to Cost Ratio
88.81 %
Debt Coverage Ratio 1.68
LOAN

Financing of: Purchase price ($ 223,500)

Type Amortized
Loan Amount $ 201,150
Down payment (10%) $ 22,350
Amortization 30 years
Interest Rate 3.67 %
Monthly Payment $ 923.02
JavaScript chart by amCharts 3.20.13

This chart shows the process of accumulation of investor's equity. There is some equity created right at the beginning with the rehab/construction and later investor's equity is rising by paying off the principal of the loan and also by appreciation over the years. All the green parts is the cummulative equity belonging to the investor and the red part belongs to the lender.

Year 012345678910
Operational Analysis
Gross Scheduled Income 0 32,100 32,742 33,397 34,065 34,746 35,441 36,150 36,873 37,610 38,362
Vacancy Loss 0 2,247 2,292 2,338 2,385 2,432 2,481 2,530 2,581 2,633 2,685
Gross Operating Income 0 29,853 30,450 31,059 31,680 32,314 32,960 33,619 34,292 34,978 35,677
Expenses 0 11,208 11,432 11,661 11,894 12,132 12,375 12,622 12,874 13,132 13,395
Net Operating Income 0 18,645 19,018 19,398 19,786 20,182 20,586 20,997 21,417 21,846 22,283
Loan Payment 0 11,076 11,076 11,076 11,076 11,076 11,076 11,076 11,076 11,076 11,076
Payment Interest Part 0 7,330 7,190 7,044 6,894 6,737 6,575 6,407 6,232 6,051 5,863
Payment Principal Part 0 3,747 3,887 4,032 4,183 4,339 4,501 4,669 4,844 5,025 5,213
Cash Flow
Repairs/Construction 3,000 0 0 0 0 0 0 0 0 0 0
Cash Flow Before Taxes -37,373 7,569 7,942 8,322 8,710 9,106 9,509 9,921 10,341 10,769 11,206
Depreciation 0 6,502 6,502 6,502 6,502 6,502 6,502 6,502 6,502 6,502 6,502
Taxes 0 1,203 1,332 1,463 1,598 1,736 1,877 2,022 2,171 2,323 2,479
Cash Flow After Taxes -37,373 6,365 6,610 6,859 7,112 7,370 7,632 7,899 8,170 8,446 8,727

Note: All amounts in the table above are in $

JavaScript chart by amCharts 3.20.13

Resale Price Evaluation Methods

The property is sold after 10 years. Below is the resale price calculated using different methods.

Appreciation (3.00%) $ 300,365
Cap Rate (8.34%) & NOI $ 267,176
Gross Rent Multiplier $ 267,003

Sale Proceeds

Projected Selling Price $ 300,365
Costs of Sale (6.00%) $ 18,022
1. Loan Balance Payoff $ 156,711
Net Sale Proceeds Before Tax $ 125,632

In the resale analysis we do not include any calculation for taxes that might be owed on sale of the property. The tax laws for the resale are rather complex and subjected to frequent changes.

Net Assets and Yield

Net Assets
Sale Proceeds Before Tax $ 125,632
Investor Cash Outlay $ 37,373
Net Assets $ 88,259
Average Yield
Annual Net Assets $ 8,826
Average Cash Flow (After Taxes) $ 6,646
Average Annual Gain (After Taxes) $ 15,472
Average Annual Yield (After Taxes) 6.92 %
JavaScript chart by amCharts 3.20.13

This charts shows Net Present Value (NPV) when property is sold in various years, i.e. when sold in 5th year, the NPV is calculated from 5 years of Cash Flow (including the selling price) and this NPV is displayed in year 5. Optimal holding period can be estimated, using this method - when NPV is the highest. Please note that appreciation growth can change these numbers greatly. It sometimes makes sense to sell the property even before the end of the mortgage term.

Lender Summary for LOAN

Financing of: Purchase price
Type: Amortized
Amortization: 30 years

Loan Assumptions % of ARV
After Repair Value $ 0 0.00 %
Purchase Price $ 223,500 %
Purchase Costs $ 12,023 %
Repair Costs $ 3,000 %
Holding Costs $ 0 0.00 %
Total Capital Needed
$ 238,523 %
Financed Amount $ 223,500 %
Down payment (10%) $ 22,350 %
Loan Amount $ 201,150 %
Lender Returns
Interest Rate 3.67 %
Interest Income $ 131,136
Points (2.000) $ 4,023
Fees $ 3,000
Total Income to Lender $ 138,159
Lender's ROI 68.68 %
Lender's Annualized ROI 2.29 %

Sign in to edit this report, add or compare properties. Don't have an acount? Sign up now!

BESbswy