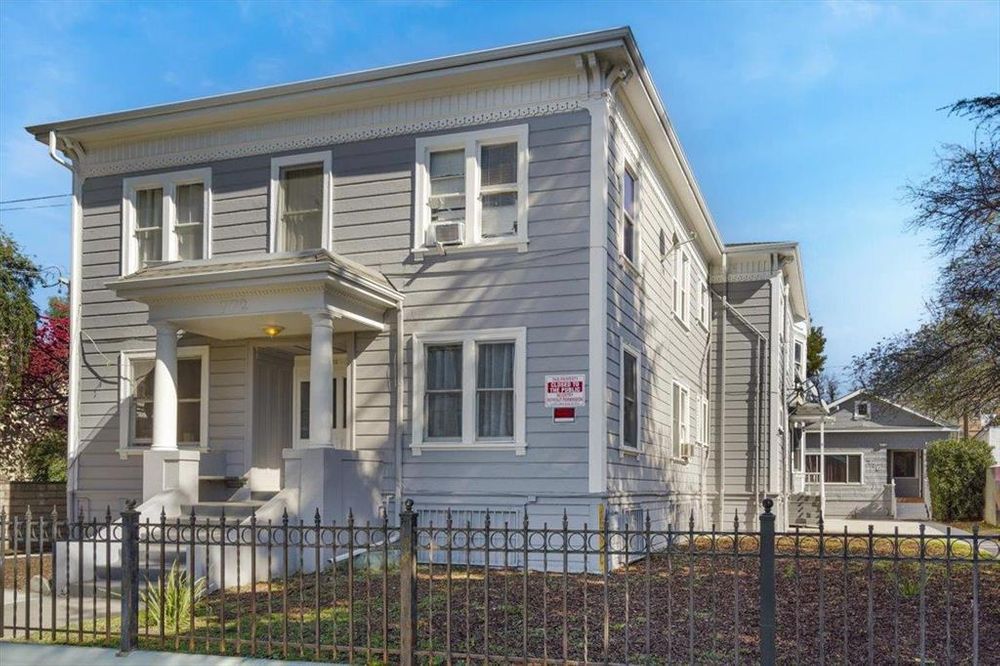
Property Report: 772 South 2nd 10 Year Analysis RENTAL

Property Report :

772 South 2nd 10 Year Analysis

772 S Second St, San Jose, CA 95112

Created on: Apr 15, 2025

Author: Scott Poncetta

772 S Second St, San Jose, CA 95112

Investment strategy: Rental Property

Purchase Price$ 2,599,000
Rent$ 12,964/mo
Monthly Cash Flow$ 1,983
Cash on Cash Return1.83 %

Financial Analysis

Cash on Cash Return 1.83 %
Internal Rate of Return (IRR) 14.69 %
Capitalization Rate 3.99 %
Gross Rent Multiplier (GRM) 16.71
Debt-coverage Ratio (DCR) 1.30
Operating Expense Ratio (OER) 37.01 %

Financial Breakdown

Purchase Price $ 2,599,000
Purchase Costs $ 0
Repair/Construction Costs $ 0
Total Capital Needed
$ 2,599,000
Financing $ 1,299,500
Total Cash Needed
$ 1,299,500
Cash at Closing
$ 1,299,500
Cash During Rehab
$ 0

Operating Analysis

Rent $ 12,964/mo
Gross Operating Income (GOI) $ 164,701
Total Expenses $ 60,960
Net Operating Income (NOI) $ 103,741
Annual Debt Service $ 79,942
Cash Flow Before Taxes (CFBT) $ 23,799
Income Tax Liability $ -3,078
Cash Flow After Taxes (CFAT) $ 26,877
Purchase Price $ 2,599,000
Address 772 S Second St , San Jose, 95112, CA
MLS® # ND21222491
Listing Agent Anthony Boudreault
Listing Broker Coldwell Banker Res Brokerage

Property History

Date Price Change Event
4/26/2001
11/7/1994
8/16/1988

Annual Property Operating Data

Incomes % of GOI
Gross Scheduled Income
$ 155,568    
Garage rental $ 13,800
Total Gross Income $ 169,368  
Vacancy loss
$ 4,667  
Gross Operating Income
$ 164,701 100.00 %
Expenses
Property manager $ 9,054 5.50 %
Utilities $ 6,016 3.65 %
Insurance $ 4,108 2.49 %
Repairs & Maintenance $ 5,695 3.46 %
Property tax $ 32,487 19.72 %
Landscaping & Garbage $ 3,600 2.19 %
Total Expenses $ 60,960 37.01 %
Net Operating Income
$ 103,741 62.99 %
JavaScript chart by amCharts 3.20.13

Cash Flow (Year 1)

Net Operating Income $ 103,741 62.99 %
Annual Debt Service $ 79,942 48.54 %
Cash Flow Before Taxes (CFBT)
$ 23,799 14.45 %
Income Tax Liability $ -3,078 -1.87 %
Cash Flow After Taxes (CFAT)
$ 26,877 16.32 %

Operating Ratios

Operating Expense Ratio
37.01 %
Break-Even Ratio
85.55 %

Financial Measures

Net Present Value
$ 1,669,914
Internal Rate of Return
14.69 %
Profitability Index
2.29
Annual Depreciation $ 56,705

Holding period of 10 years and discount rate of 5.00% were used for calculation of NPV and IRR. The rest of the financial measures are for the 1st year only and therefore don't provide such an exact information.

Investment Return Ratios

Cash on Cash Return
1.83 %
Return on Investment
17.83 %
Capitalization Rate
3.99 %
Gross Rental Yield
5.99 %
Gross Rent Multiplier
16.71
Financing
Down Payment $ 1,299,500
Loan $ 1,299,500
Loan to Value Ratio
50.00 %
Loan to Cost Ratio
50.00 %
Debt Coverage Ratio 1.30
Loan

Financing of: Purchase price ($ 2,599,000)

Type Amortized
Loan Amount $ 1,299,500
Down payment (50%) $ 1,299,500
Amortization 30 years
Interest Rate 4.60 %
Monthly Payment $ 6,661.81
JavaScript chart by amCharts 3.20.13

This chart shows the process of accumulation of investor's equity. There is some equity created right at the beginning with the rehab/construction and later investor's equity is rising by paying off the principal of the loan and also by appreciation over the years. All the green parts is the cummulative equity belonging to the investor and the red part belongs to the lender.

Year 012345678910
Operational Analysis
Gross Scheduled Income 0 169,368 177,146 185,314 193,889 202,894 212,349 222,276 232,700 243,645 255,137
Vacancy Loss 0 4,667 4,900 5,145 5,403 5,673 5,956 6,254 6,567 6,895 7,240
Gross Operating Income 0 164,701 172,246 180,168 188,487 197,221 206,392 216,022 226,133 236,749 247,897
Expenses 0 60,960 62,179 63,423 64,691 65,985 67,305 68,651 70,024 71,424 72,853
Net Operating Income 0 103,741 110,067 116,745 123,795 131,236 139,087 147,371 156,109 165,325 175,044
Loan Payment 0 79,942 79,942 79,942 79,942 79,942 79,942 79,942 79,942 79,942 79,942
Payment Interest Part 0 59,346 58,379 57,366 56,305 55,194 54,032 52,814 51,540 50,206 48,809
Payment Principal Part 0 20,595 21,563 22,576 23,637 24,747 25,910 27,127 28,402 29,736 31,133
Cash Flow
Repairs/Construction 0 0 0 0 0 0 0 0 0 0 0
Cash Flow Before Taxes -1,299,500 23,799 30,125 36,804 43,854 51,294 59,146 67,429 76,167 85,383 95,102
Depreciation 0 56,705 56,705 56,705 56,705 56,705 56,705 56,705 56,705 56,705 56,705
Taxes 0 -3,078 -1,254 669 2,696 4,834 7,088 9,463 11,966 14,604 17,383
Cash Flow After Taxes -1,299,500 26,877 31,379 36,135 41,157 46,460 52,058 57,966 64,201 70,780 77,720

Note: All amounts in the table above are in $

JavaScript chart by amCharts 3.20.13

Resale Price Evaluation Methods

The property is sold after 10 years. Below is the resale price calculated using different methods.

Appreciation (8.00%) $ 5,611,046
Cap Rate (3.99%) & NOI $ 4,387,068
Gross Rent Multiplier $ 4,263,340

Sale Proceeds

Projected Selling Price $ 5,611,046
Costs of Sale (6.00%) $ 336,663
1. Loan Balance Payoff $ 1,044,073
Net Sale Proceeds Before Tax $ 4,230,310

In the resale analysis we do not include any calculation for taxes that might be owed on sale of the property. The tax laws for the resale are rather complex and subjected to frequent changes.

Net Assets and Yield

Net Assets
Sale Proceeds Before Tax $ 4,230,310
Investor Cash Outlay $ 1,299,500
Net Assets $ 2,930,810
Average Yield
Annual Net Assets $ 293,081
Average Cash Flow (After Taxes) $ 42,701
Average Annual Gain (After Taxes) $ 335,782
Average Annual Yield (After Taxes) 12.92 %
JavaScript chart by amCharts 3.20.13

This charts shows Net Present Value (NPV) when property is sold in various years, i.e. when sold in 5th year, the NPV is calculated from 5 years of Cash Flow (including the selling price) and this NPV is displayed in year 5. Optimal holding period can be estimated, using this method - when NPV is the highest. Please note that appreciation growth can change these numbers greatly. It sometimes makes sense to sell the property even before the end of the mortgage term.

Sign in to edit this report, add or compare properties. Don't have an acount? Sign up now!

BESbswy