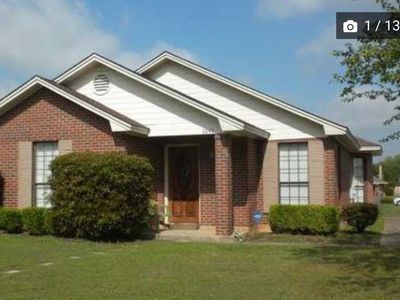
Property Report: 6943 Bluegrass Stakes, Montgomery RENTAL

Property Report :

6943 Bluegrass Stakes, Montgomery, AL 36117

Created on: Apr 14, 2025

Author: gherkin huff

6943 Bluegrass Stakes, Montgomery, AL 36117

Singlefamily: 4 rooms: 2 bedrooms , 2 bathrooms

Year built: 1992, Size: 1043 SF

Investment strategy: Rental Property

Purchase Price$ 90,000
Rent$ 800/mo
Monthly Cash Flow$ 58
Cash on Cash Return3.45 %

Financial Analysis

Cash on Cash Return 3.45 %
Internal Rate of Return (IRR) 14.59 %
Capitalization Rate 5.63 %
Gross Rent Multiplier (GRM) 9.38
Debt-coverage Ratio (DCR) 1.16
Operating Expense Ratio (OER) 37.89 %

Financial Breakdown

Purchase Price $ 90,000
Purchase Costs $ 2,000
Repair/Construction Costs $ 0
Total Capital Needed
$ 92,000
Financing $ 72,000
Total Cash Needed
$ 20,000
Cash at Closing
$ 18,000
Cash During Rehab
$ 2,000

Operating Analysis

Rent $ 800/mo
Gross Operating Income (GOI) $ 8,160
Total Expenses $ 3,092
Net Operating Income (NOI) $ 5,068
Annual Debt Service $ 4,378
Cash Flow Before Taxes (CFBT) $ 690
Income Tax Liability $ -192
Cash Flow After Taxes (CFAT) $ 882

Newly painted throughout entire house, stainless steel appliances, large backyard, hardwood floors

Tenant pays utilities. Landlord pays pest control

Purchase Price $ 90,000
Address 6943 Bluegrass Stakes , Montgomery, 36117, AL
Year Built 1992
Type Singlefamily
Size 1043 SF
Bedrooms 2
Bathrooms 2
Rooms Total 4
Current Owner
Full name Shawnee Sharifi
Address 6943 BLUEGRASS STAKES, MONTGOMERY, AL 36117-6713

Annual Property Operating Data

Incomes % of GOI
Gross Scheduled Income
$ 9,600    
Total Gross Income $ 9,600  
Vacancy loss
$ 1,440  
Gross Operating Income
$ 8,160 100.00 %
Expenses
Property manager $ 816 10.00 %
Insurance $ 460 5.64 %
Repairs $ 816 10.00 %
Property tax $ 1,000 12.25 %
Total Expenses $ 3,092 37.89 %
Net Operating Income
$ 5,068 62.11 %
JavaScript chart by amCharts 3.20.13

Cash Flow (Year 1)

Net Operating Income $ 5,068 62.11 %
Annual Debt Service $ 4,378 53.65 %
Cash Flow Before Taxes (CFBT)
$ 690 8.46 %
Income Tax Liability $ -192 -2.35 %
Cash Flow After Taxes (CFAT)
$ 882 10.81 %

Operating Ratios

Operating Expense Ratio
37.89 %
Break-Even Ratio
91.54 %

Financial Measures

Net Present Value
$ 23,264
Internal Rate of Return
14.59 %
Profitability Index
2.16
Annual Depreciation $ 2,618

Holding period of 10 years and discount rate of 5.00% were used for calculation of NPV and IRR. The rest of the financial measures are for the 1st year only and therefore don't provide such an exact information.

Investment Return Ratios

Cash on Cash Return
3.45 %
Return on Investment
16.95 %
Capitalization Rate
5.63 %
Gross Rental Yield
10.67 %
Gross Rent Multiplier
9.38
Financing
Down Payment $ 18,000
Loan $ 72,000
Loan to Value Ratio
80.00 %
Loan to Cost Ratio
80.00 %
Debt Coverage Ratio 1.16
Loan

Financing of: Purchase price ($ 90,000)

Type Amortized
Loan Amount $ 72,000
Down payment (20%) $ 18,000
Amortization 30 years
Interest Rate 4.50 %
Monthly Payment $ 364.81
JavaScript chart by amCharts 3.20.13

This chart shows the process of accumulation of investor's equity. There is some equity created right at the beginning with the rehab/construction and later investor's equity is rising by paying off the principal of the loan and also by appreciation over the years. All the green parts is the cummulative equity belonging to the investor and the red part belongs to the lender.

Year 012345678910
Operational Analysis
Gross Scheduled Income 0 9,600 9,792 9,988 10,188 10,391 10,599 10,811 11,027 11,248 11,473
Vacancy Loss 0 1,440 1,469 1,498 1,528 1,559 1,590 1,622 1,654 1,687 1,721
Gross Operating Income 0 8,160 8,323 8,490 8,659 8,833 9,009 9,189 9,373 9,561 9,752
Expenses 0 3,092 3,154 3,217 3,281 3,347 3,414 3,482 3,552 3,623 3,695
Net Operating Income 0 5,068 5,169 5,273 5,378 5,486 5,595 5,707 5,822 5,938 6,057
Loan Payment 0 4,378 4,378 4,378 4,378 4,378 4,378 4,378 4,378 4,378 4,378
Payment Interest Part 0 3,216 3,163 3,107 3,049 2,988 2,924 2,857 2,787 2,714 2,638
Payment Principal Part 0 1,162 1,215 1,271 1,329 1,390 1,454 1,521 1,591 1,664 1,740
Cash Flow
Repairs/Construction 0 0 0 0 0 0 0 0 0 0 0
Cash Flow Before Taxes -20,000 690 792 895 1,000 1,108 1,218 1,330 1,444 1,560 1,679
Depreciation 0 2,618 2,618 2,618 2,618 2,618 2,618 2,618 2,618 2,618 2,618
Taxes 0 -192 -153 -113 -72 -30 13 58 104 151 200
Cash Flow After Taxes -20,000 882 944 1,008 1,073 1,138 1,204 1,272 1,340 1,409 1,479

Note: All amounts in the table above are in $

JavaScript chart by amCharts 3.20.13

Resale Price Evaluation Methods

The property is sold after 10 years. Below is the resale price calculated using different methods.

Appreciation (3.00%) $ 120,952
Cap Rate (5.63%) & NOI $ 107,580
Gross Rent Multiplier $ 107,616

Sale Proceeds

Projected Selling Price $ 120,952
Costs of Sale (6.00%) $ 7,257
1. Loan Balance Payoff $ 57,664
Net Sale Proceeds Before Tax $ 56,030

In the resale analysis we do not include any calculation for taxes that might be owed on sale of the property. The tax laws for the resale are rather complex and subjected to frequent changes.

Net Assets and Yield

Net Assets
Sale Proceeds Before Tax $ 56,030
Investor Cash Outlay $ 20,000
Net Assets $ 36,030
Average Yield
Annual Net Assets $ 3,603
Average Cash Flow (After Taxes) $ 1,027
Average Annual Gain (After Taxes) $ 4,630
Average Annual Yield (After Taxes) 5.14 %
JavaScript chart by amCharts 3.20.13

This charts shows Net Present Value (NPV) when property is sold in various years, i.e. when sold in 5th year, the NPV is calculated from 5 years of Cash Flow (including the selling price) and this NPV is displayed in year 5. Optimal holding period can be estimated, using this method - when NPV is the highest. Please note that appreciation growth can change these numbers greatly. It sometimes makes sense to sell the property even before the end of the mortgage term.

Sign in to edit this report, add or compare properties. Don't have an acount? Sign up now!

BESbswy