RECO REAL ESTATE ADVISORS
6850 COLLEGE BLVD
OVERLAND PARK KS 66211

Property Report: 6901 Daniel Ranch Drive, Austin RENTAL

Property Report :

6901 Daniel Ranch Drive, Austin, TX 78744

Created on: Apr 14, 2025

Author: Dharam Chaudhari

Company: RECO REAL ESTATE ADVISORS

6901 Daniel Ranch Drive, Austin, TX 78744

Singlefamily: 5 bedrooms , 3 bathrooms

Year built: 2023, Size: 3475 SF

Investment strategy: Rental Property

Purchase Price$ 583,221
Rent$ 3,000/mo
Monthly Cash Flow$ -880
Cash on Cash Return-4.42 %

Financial Analysis

Cash on Cash Return -4.42 %
Internal Rate of Return (IRR) 4.96 %
Capitalization Rate 3.22 %
Gross Rent Multiplier (GRM) 16.20
Debt-coverage Ratio (DCR) 0.64
Operating Expense Ratio (OER) 45.60 %
After Repair Value $ 583,221

Financial Breakdown

Purchase Price $ 583,221
Purchase Costs $ 5,832
Repair/Construction Costs $ 0
Total Capital Needed
$ 589,053
Financing $ 349,933
Total Cash Needed
$ 239,120
Cash at Closing
$ 233,288
Cash During Rehab
$ 5,832

Operating Analysis

Rent $ 3,000/mo
Gross Operating Income (GOI) $ 34,560
Total Expenses $ 15,759
Net Operating Income (NOI) $ 18,801
Annual Debt Service $ 29,361
Cash Flow Before Taxes (CFBT) $ -10,560
Income Tax Liability $ -6,075
Cash Flow After Taxes (CFAT) $ -4,485

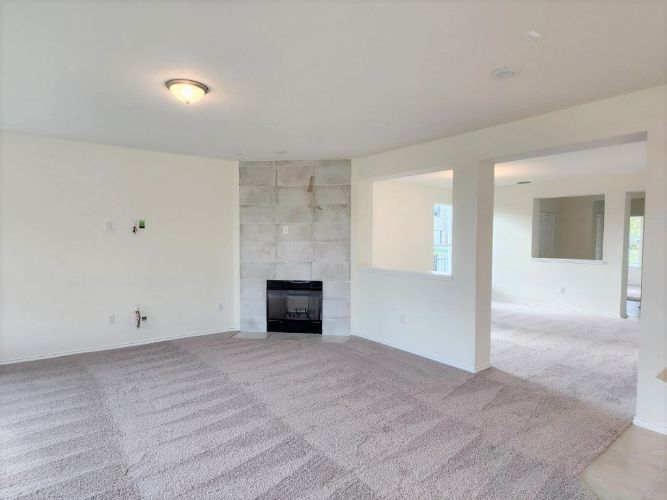
**BUYER INCENTIVE AVAILABLE, SEE SALES TEAM FOR DETAILS** This beautiful, two-story home offers an open floor plan with 9-ft. first-floor ceilings, Flex Space and a cozy corner fireplace in the spacious family room. The modern kitchen showcases a breakfast nook, Woodmont Shaker-style 42-in. upper cabinets in White, Silestone countertops and tile backsplash. A downstairs bedroom with full bath downstairs is perfect for overnigh guests. Upstairs, a loft provides space for a study or workout area. The primary suite features an adjoining study and connecting bath that boasts a garden tub and separate shower with tile surround. Additional features include plush carpeting at family room, Flex Space, game room and bedrooms, tile flooring at kitchen, breakfast nook and baths, and Sherwin-Williams zero-VOC interior paint. Entertain family and friends on the covered back patio.

Purchase Price $ 583,221
Address 6901 Daniel Ranch Drive , Austin, 78744, TX
MLS® # 9291747
Year Built 2023
Type Singlefamily
Size 3475 SF
Bedrooms 5
Bathrooms 3

Annual Property Operating Data

Incomes % of GOI
Gross Scheduled Income
$ 36,000    
Total Gross Income $ 36,000  
Vacancy loss
$ 1,440  
Gross Operating Income
$ 34,560 100.00 %
Expenses
Property manager $ 3,456 10.00 %
Association fees $ 5,760 16.67 %
Property tax $ 6,543 18.93 %
Total Expenses $ 15,759 45.60 %
Net Operating Income
$ 18,801 54.40 %
JavaScript chart by amCharts 3.20.13

Cash Flow (Year 1)

Net Operating Income $ 18,801 54.40 %
Annual Debt Service $ 29,361 84.96 %
Cash Flow Before Taxes (CFBT)
$ -10,560 -30.56 %
Income Tax Liability $ -6,075 -17.58 %
Cash Flow After Taxes (CFAT)
$ -4,485 -12.98 %

Operating Ratios

Operating Expense Ratio
45.60 %
Break-Even Ratio
130.56 %

Financial Measures

Net Present Value
$ -934
Internal Rate of Return
4.96 %
Profitability Index
1.00
Annual Depreciation $ 16,966

Holding period of 10 years and discount rate of 5.00% were used for calculation of NPV and IRR. The rest of the financial measures are for the 1st year only and therefore don't provide such an exact information.

Investment Return Ratios

Cash on Cash Return
-4.42 %
Return on Investment
2.90 %
Capitalization Rate
3.22 %
Gross Rental Yield
6.17 %
Gross Rent Multiplier
16.20
Financing % of ARV
Down Payment $ 233,288 40.00 %
Loan $ 349,933 60.00 %
Loan to Value Ratio
60.00 %
Loan to Cost Ratio
60.00 %
Debt Coverage Ratio 0.64
Loan

Financing of: Purchase price ($ 583,221)

Type Amortized
Loan Amount $ 349,933
Down payment (40%) $ 233,288
Amortization 30 years
Interest Rate 7.50 %
Monthly Payment $ 2,446.78
JavaScript chart by amCharts 3.20.13

This chart shows the process of accumulation of investor's equity. There is some equity created right at the beginning with the rehab/construction and later investor's equity is rising by paying off the principal of the loan and also by appreciation over the years. All the green parts is the cummulative equity belonging to the investor and the red part belongs to the lender.

Year 012345678910
Operational Analysis
Gross Scheduled Income 0 36,000 36,720 37,454 38,203 38,968 39,747 40,542 41,353 42,180 43,023
Vacancy Loss 0 1,440 1,469 1,498 1,528 1,559 1,590 1,622 1,654 1,687 1,721
Gross Operating Income 0 34,560 35,251 35,956 36,675 37,409 38,157 38,920 39,699 40,493 41,302
Expenses 0 15,759 16,074 16,396 16,724 17,058 17,399 17,747 18,102 18,464 18,833
Net Operating Income 0 18,801 19,177 19,561 19,952 20,351 20,758 21,173 21,596 22,028 22,469
Loan Payment 0 29,361 29,361 29,361 29,361 29,361 29,361 29,361 29,361 29,361 29,361
Payment Interest Part 0 26,136 25,885 25,615 25,324 25,011 24,673 24,309 23,917 23,495 23,039
Payment Principal Part 0 3,226 3,476 3,746 4,037 4,350 4,688 5,052 5,444 5,867 6,322
Cash Flow
Repairs/Construction 0 0 0 0 0 0 0 0 0 0 0
Cash Flow Before Taxes -239,120 -10,560 -10,184 -9,801 -9,410 -9,011 -8,604 -8,188 -7,765 -7,333 -6,892
Depreciation 0 16,966 16,966 16,966 16,966 16,966 16,966 16,966 16,966 16,966 16,966
Taxes 0 -6,075 -5,919 -5,755 -5,585 -5,407 -5,220 -5,026 -4,822 -4,608 -4,384
Cash Flow After Taxes -239,120 -4,485 -4,266 -4,046 -3,825 -3,604 -3,383 -3,163 -2,943 -2,725 -2,508

Note: All amounts in the table above are in $

JavaScript chart by amCharts 3.20.13

Resale Price Evaluation Methods

The property is sold after 10 years. Below is the resale price calculated using different methods.

Appreciation (3.00%) $ 783,800
Cap Rate (3.22%) & NOI $ 697,793
Gross Rent Multiplier $ 696,978

Sale Proceeds

Projected Selling Price $ 783,800
Costs of Sale (6.00%) $ 47,028
1. Loan Balance Payoff $ 303,724
Net Sale Proceeds Before Tax $ 433,048

In the resale analysis we do not include any calculation for taxes that might be owed on sale of the property. The tax laws for the resale are rather complex and subjected to frequent changes.

Net Assets and Yield

Net Assets
Sale Proceeds Before Tax $ 433,048
Investor Cash Outlay $ 239,120
Net Assets $ 193,928
Average Yield
Annual Net Assets $ 19,393
Average Cash Flow (After Taxes) $ -3,244
Average Annual Gain (After Taxes) $ 16,149
Average Annual Yield (After Taxes) 2.77 %
JavaScript chart by amCharts 3.20.13

This charts shows Net Present Value (NPV) when property is sold in various years, i.e. when sold in 5th year, the NPV is calculated from 5 years of Cash Flow (including the selling price) and this NPV is displayed in year 5. Optimal holding period can be estimated, using this method - when NPV is the highest. Please note that appreciation growth can change these numbers greatly. It sometimes makes sense to sell the property even before the end of the mortgage term.

Sign in to edit this report, add or compare properties. Don't have an acount? Sign up now!

BESbswy