Property Report: 2/2 RENTAL
Property Report :
2/2
6763 Nebraska Ave, Hammond, IN 46323
Powered by
Real Estate Analysis
![]()
Created on: Apr 16, 2025
Author: Phillip Dunbar
Company: Key Land Holdings LLC
Executive Summary
6763 Nebraska Ave, Hammond, IN 46323
Townhouse: 8 rooms: 2 bedrooms , 2 bathrooms
Year built: 1970, Size: 1056 SF
Investment strategy: Rental Property

Financial Analysis
| Cash on Cash Return | 13.09 % |
| Internal Rate of Return (IRR) | 15.05 % |
| Capitalization Rate | 9.17 % |
| Gross Rent Multiplier (GRM) | 5.45 |
| Debt-coverage Ratio (DCR) | 0.00 |
| Operating Expense Ratio (OER) | 50.00 % |
| After Repair Value | $USD 72,000 |
| Profit/Equity From Rehab | $USD 21,590 |
Financial Breakdown
| Purchase Price | $USD 40,000 |
| Purchase Costs | $USD 410 |
| Repair/Construction Costs | $USD 10,000 |
| $USD 50,410 | |
| Financing | $USD 0 |
| $USD 50,410 | |
| $USD 0 | |
| $USD 50,410 |
Operating Analysis
| Rent | $USD 1,100/mo |
| Gross Operating Income (GOI) | $USD 13,200 |
| Total Expenses | $USD 6,600 |
| Net Operating Income (NOI) | $USD 6,600 |
| Annual Debt Service | $USD 0 |
| Cash Flow Before Taxes (CFBT) | $USD 6,600 |
| Income Tax Liability | $USD 1,359 |
| Cash Flow After Taxes (CFAT) | $USD 5,241 |
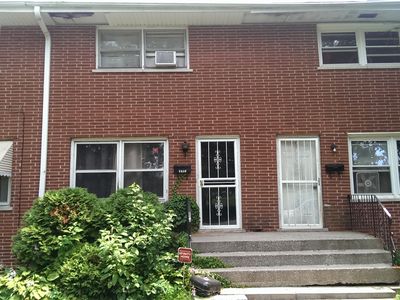
Property Description
Amazing Rental opportunity located near Purdue University Northwest. Good school district and close access to I-94. Home has been well kept and requires very few if any repairs. Property consists of 2 Bedrooms and 1.5 Bathrooms. Partially finished basement with a bonus 3rd Bedroom as well. Currently occupied by long term tenants of 10+ years on a month-month basis. Current tenant pays $750/month + all utilities but market rent can be set at $950+/month. Get your hands on this Townhome that has ZERO HOA fees Today!
| Purchase Price | $USD 40,000 |
| Address | 6763 Nebraska Ave , Hammond, 46323, IN |
| Year Built | 1970 |
| Type | Townhouse |
| Size | 1056 SF |
| Bedrooms | 2 |
| Bathrooms | 2 |
| Rooms Total | 8 |

Comparative Sales Analysis
-
$USD 72,000
Property ARV
-
Townhouse
Bldg type
-
1,056
SqFt
-
$USD 68
per SqFt
-
2
Beds
-
2
Baths
| # | Property address | Distance | Beds | Baths | SqFt | Bldg type | Date sold | Sale price | $/SqFt |
|---|---|---|---|---|---|---|---|---|---|
| 1 | 6327 Nevada Ave | 0.6mi | 3 | 1 | 1,056 | 03/27/2019 | $USD 87,500 | $USD 83 | |
| 2 | 6428 Nebraska Ave | 0.4mi | 3 | 1 | 672 | 08/14/18 | $USD 89,500 | $USD 133 | |
| 3 | 6408 Nebraska Ave | 0.5mi | 3 | 1 | 984 | 05/03/2019 | $USD 85,000 | $USD 86 | |
| 4 | 3128 Kenwood St | 0.8mi | 2 | 1 | 958 | 12/10/2018 | $USD 97,500 | $USD 102 | |
| Average: | $USD 89,875 | $USD 101 | |||||||
Operating Analysis
Financial Analysis
Financing Overview
Long-term Cash Flow Forecast
Resale Analysis
Lender Report
Photos
Sign in to edit this report, add or compare properties. Don't have an acount? Sign up now!