{{ label }}


Real Estate Analysis


Property Report: 5421 Queen Mary Ln RENTAL PUBLISHED
Property Report :
5421 Queen Mary Ln
5421 Queen Mary Ln, Jackson, MS 39209
Powered by
Real Estate Analysis
![]()
Created on: Apr 14, 2025
Author: James Gosa
Company: James Gosa Wholesale Properties
Executive Summary
5421 Queen Mary Ln, Jackson, MS 39209
Singlefamily: 4 bedrooms , 1 bathroom
Year built: 1962, Size: 2200 SF
Investment strategy: Rental Property
Investment strategy: Rental Property or fix and flip
Purchase Price$ 36,000
Rent$ 925/mo
Monthly Cash Flow$ 700
Cash on Cash Return18.83 %
Financial Analysis
| Cash on Cash Return | 18.83 % |
| Internal Rate of Return (IRR) | 18.19 % |
| Capitalization Rate | 15.27 % |
| Gross Rent Multiplier (GRM) | 4.95 |
| Debt-coverage Ratio (DCR) | 0.00 |
| Operating Expense Ratio (OER) | 23.56 % |
| After Repair Value | $ 55,000 |
| Profit/Equity From Rehab | $ 10,400 |
Financial Breakdown
| Purchase Price | $ 36,000 |
| Purchase Costs | $ 600 |
| Repair/Construction Costs | $ 8,000 |
| $ 44,600 | |
| Financing | $ 0 |
| $ 44,600 | |
| $ 0 | |
| $ 44,600 |
Operating Analysis
| Rent | $ 925/mo |
| Gross Operating Income (GOI) | $ 10,989 |
| Total Expenses | $ 2,589 |
| Net Operating Income (NOI) | $ 8,400 |
| Annual Debt Service | $ 0 |
| Cash Flow Before Taxes (CFBT) | $ 8,400 |
| Income Tax Liability | $ 1,838 |
| Cash Flow After Taxes (CFAT) | $ 6,562 |
Property Description
4TH OF JULY SPECIAL-SPACIOUS HOME, MOVE IN READY, CENTRAL AC AND HEATING. A MUST SEE
APPLICATION FEE $0
PLENTY OF ROOM FOR ENTERTAINING
| Purchase Price | $ 36,000 |
| Address | 5421 Queen Mary Ln , Jackson, 39209, MS |
| Year Built | 1962 |
| Type | Singlefamily |
| Size | 2200 SF |
| Bedrooms | 4 |
| Bathrooms | 1 |
Operating Analysis
Financial Analysis
Financing Overview
Long-term Cash Flow Forecast
Resale Analysis
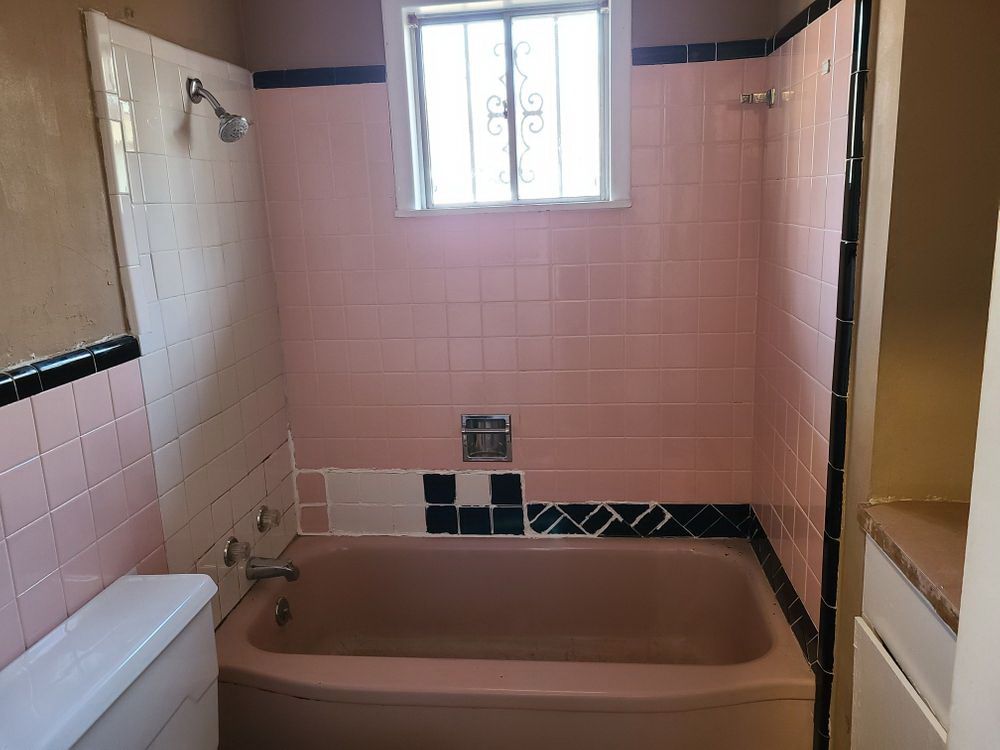
Photos
Sign in to edit this report, add or compare properties. Don't have an acount? Sign up now!