Property Report: 5149 Nicholson Dr Unit 76, Baton Rouge RENTAL

Property Report :

5149 Nicholson Dr Unit 76, Baton Rouge, LA 70820

Created on: Apr 15, 2025

Author: Corrine Germain

5149 Nicholson Dr Unit 76, Baton Rouge, LA 70820

Condominium: 3 bedrooms , 2 bathrooms

Size: 1473 SF

Investment strategy: Rental Property

Purchase Price$ 129,000
Rent$ 1,300/mo
Monthly Cash Flow$ 154
Cash on Cash Return7.14 %

Financial Analysis

Cash on Cash Return 7.14 %
Internal Rate of Return (IRR) 19.17 %
Capitalization Rate 6.01 %
Gross Rent Multiplier (GRM) 8.27
Debt-coverage Ratio (DCR) 1.31
Operating Expense Ratio (OER) 47.68 %

Financial Breakdown

Purchase Price $ 129,000
Purchase Costs $ 0
Repair/Construction Costs $ 0
Total Capital Needed
$ 129,000
Financing $ 103,200
Total Cash Needed
$ 25,800
Cash at Closing
$ 25,800
Cash During Rehab
$ 0

Operating Analysis

Rent $ 1,300/mo
Gross Operating Income (GOI) $ 14,820
Total Expenses $ 7,066
Net Operating Income (NOI) $ 7,754
Annual Debt Service $ 5,912
Cash Flow Before Taxes (CFBT) $ 1,842
Income Tax Liability $ -23
Cash Flow After Taxes (CFAT) $ 1,865

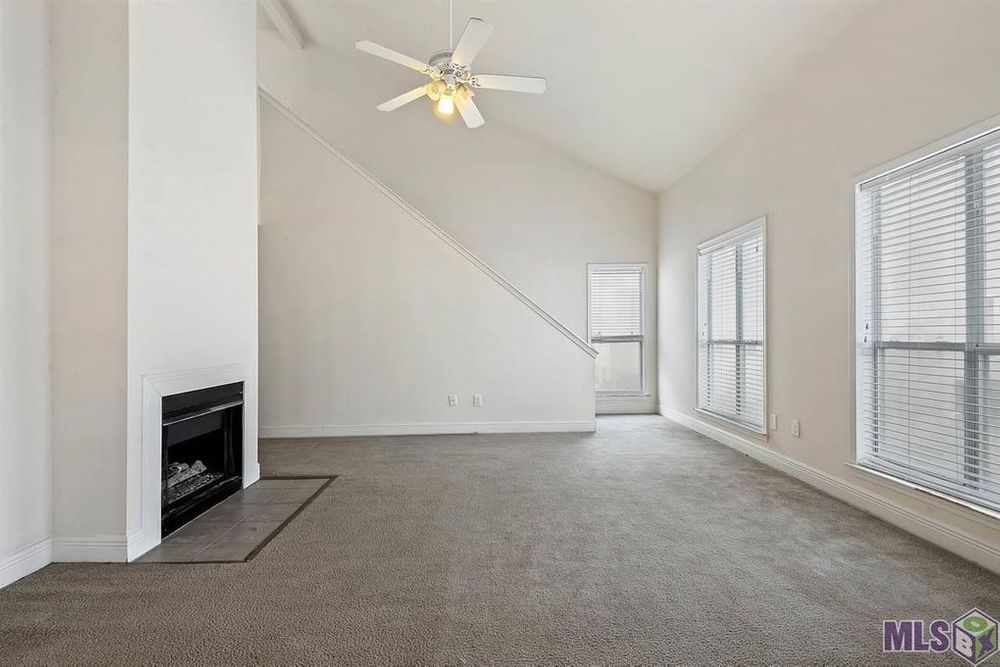
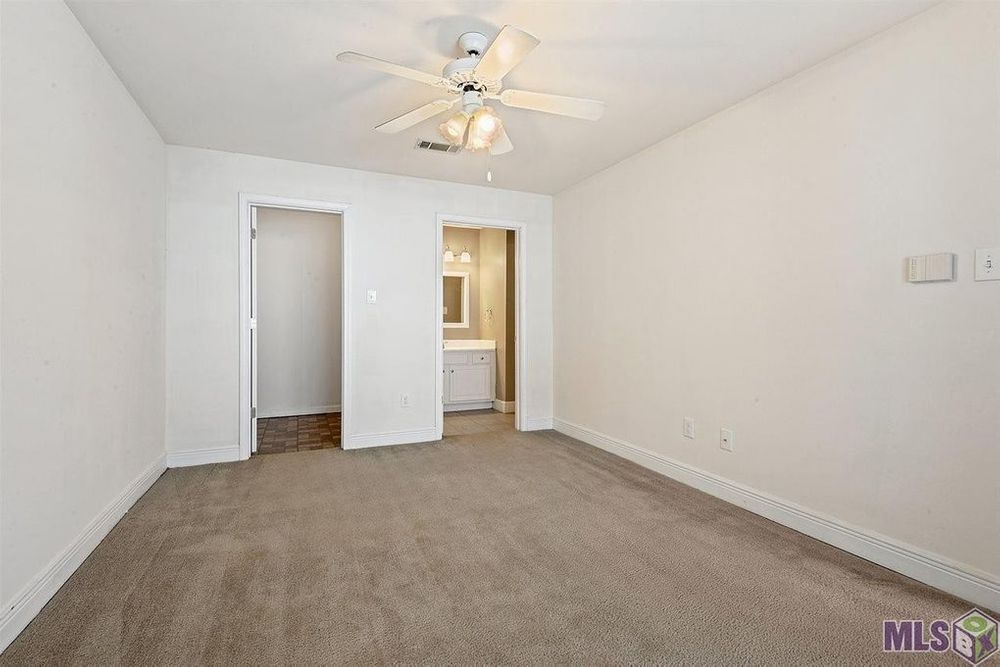
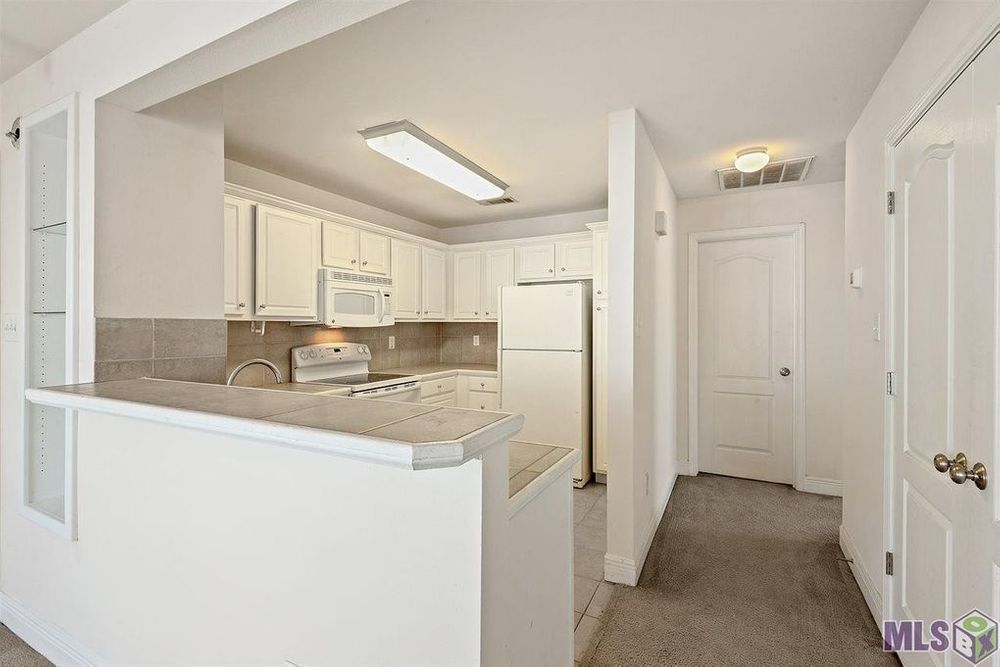
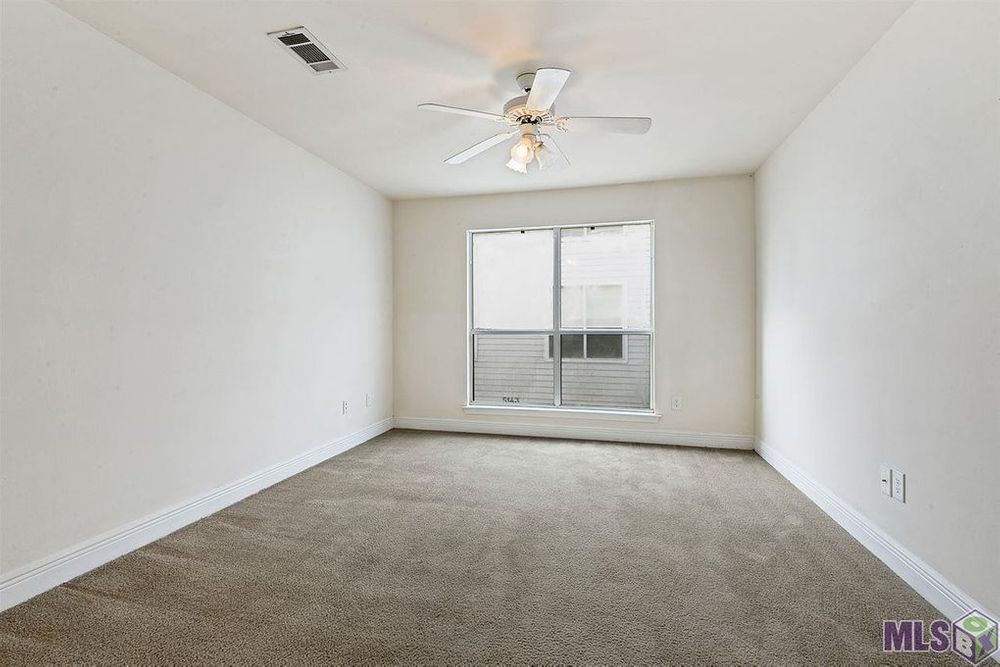
Well maintained Condo awaiting its new owners! This open airy floor-plan features 3 large bedrooms and two baths. Condo comes with all appliances including a washer and dryer! Located on the LSU bus route, you don't want to miss this excellent opportunity. The fireplace, balcony for BBQs, and swimming pools make for perfect entertaining or tailgating parties. And for the student, this split floor plan gives each tenant the privacy needed for quiet studying. The kitchen has a breakfast bar, plenty of storage, and a formal dining area. A great investment opportunity and less than 1.5 miles from Tiger Stadium and Alex Box Stadium, convenient to LSU campus and downtown. Easy access to bike lanes, restaurants, a coffee shop, and more! With new construction around the corner, this is a rapidly growing hot spot that you don't want to miss! This is the perfect location for an LSU student or a downtown commuter. HOA fees include cable, internet, pool, insurance (covers roof), water, sewer, trash, termite, basic cable, internet, ext maintenance, and someone on the premises/security.

Purchase Price $ 129,000
Address 5149 Nicholson Dr Unit 76 , Baton Rouge, 70820, LA
MLS® # 2021004494
Listing Agent Mary Marchive
Listing Broker Elite Realty LLC
Type Condominium
Size 1473 SF
Bedrooms 3
Bathrooms 2

Annual Property Operating Data

Incomes % of GOI
Gross Scheduled Income
$ 15,600    
Total Gross Income $ 15,600  
Vacancy loss
$ 780  
Gross Operating Income
$ 14,820 100.00 %
Expenses
Property manager $ 1,186 8.00 %
Association fees $ 4,008 27.04 %
Insurance $ 672 4.53 %
Maintenance $ 1,200 8.10 %
Total Expenses $ 7,066 47.68 %
Net Operating Income
$ 7,754 52.32 %
JavaScript chart by amCharts 3.20.13
JavaScript chart by amCharts 3.20.13CFBT Loan paymentProperty managerAssociation feesInsuranceMaintenance

Cash Flow (Year 1)

Net Operating Income $ 7,754 52.32 %
Annual Debt Service $ 5,912 39.89 %
Cash Flow Before Taxes (CFBT)
$ 1,842 12.43 %
Income Tax Liability $ -23 -0.16 %
Cash Flow After Taxes (CFAT)
$ 1,865 12.59 %

Operating Ratios

Operating Expense Ratio
47.68 %
Break-Even Ratio
87.57 %

Financial Measures

Net Present Value
$ 20,102
Internal Rate of Return
19.17 %
Profitability Index
1.78
Annual Depreciation $ 3,753

Holding period of 5 years and discount rate of 5.00% were used for calculation of NPV and IRR. The rest of the financial measures are for the 1st year only and therefore don't provide such an exact information.

Investment Return Ratios

Cash on Cash Return
7.14 %
Return on Investment
22.14 %
Capitalization Rate
6.01 %
Gross Rental Yield
12.09 %
Gross Rent Multiplier
8.27
Financing
Down Payment $ 25,800
Loan $ 103,200
Loan to Value Ratio
80.00 %
Loan to Cost Ratio
80.00 %
Debt Coverage Ratio 1.31
Loan

Financing of: Purchase price ($ 129,000)

Type Amortized
Loan Amount $ 103,200
Down payment (20%) $ 25,800
Amortization 30 years
Interest Rate 4.00 %
Monthly Payment $ 492.69
JavaScript chart by amCharts 3.20.13
JavaScript chart by amCharts 3.20.13Down Payment Loan
JavaScript chart by amCharts 3.20.13
JavaScript chart by amCharts 3.20.13Loan Principal Balance Equity: Principal Paid Equity: Cash Outlay Equity: Appreciation

This chart shows the process of accumulation of investor's equity. There is some equity created right at the beginning with the rehab/construction and later investor's equity is rising by paying off the principal of the loan and also by appreciation over the years. All the green parts is the cummulative equity belonging to the investor and the red part belongs to the lender.

Year 012345
Operational Analysis
Gross Scheduled Income 0 15,600 15,912 16,230 16,555 16,886
Vacancy Loss 0 780 796 812 828 844
Gross Operating Income 0 14,820 15,116 15,419 15,727 16,042
Expenses 0 7,066 7,207 7,351 7,498 7,648
Net Operating Income 0 7,754 7,909 8,068 8,229 8,394
Loan Payment 0 5,912 5,912 5,912 5,912 5,912
Payment Interest Part 0 4,095 4,021 3,944 3,864 3,780
Payment Principal Part 0 1,817 1,891 1,968 2,049 2,132
Cash Flow
Repairs/Construction 0 0 0 0 0 0
Cash Flow Before Taxes -25,800 1,842 1,997 2,155 2,317 2,481
Depreciation 0 3,753 3,753 3,753 3,753 3,753
Taxes 0 -23 34 93 153 215
Cash Flow After Taxes -25,800 1,865 1,963 2,063 2,164 2,266

Note: All amounts in the table above are in $

JavaScript chart by amCharts 3.20.13
JavaScript chart by amCharts 3.20.13GOINOICFBTCFAT

Resale Price Evaluation Methods

The property is sold after 5 years. Below is the resale price calculated using different methods.

Appreciation (3.00%) $ 149,546
Cap Rate (6.01%) & NOI $ 139,661
Gross Rent Multiplier $ 139,647

Sale Proceeds

Projected Selling Price $ 149,546
Costs of Sale (6.00%) $ 8,973
1. Loan Balance Payoff $ 93,342
Net Sale Proceeds Before Tax $ 47,231

In the resale analysis we do not include any calculation for taxes that might be owed on sale of the property. The tax laws for the resale are rather complex and subjected to frequent changes.

Net Assets and Yield

Net Assets
Sale Proceeds Before Tax $ 47,231
Investor Cash Outlay $ 25,800
Net Assets $ 21,431
Average Yield
Annual Net Assets $ 4,286
Average Cash Flow (After Taxes) $ 1,611
Average Annual Gain (After Taxes) $ 5,897
Average Annual Yield (After Taxes) 4.57 %
JavaScript chart by amCharts 3.20.13

This charts shows Net Present Value (NPV) when property is sold in various years, i.e. when sold in 5th year, the NPV is calculated from 5 years of Cash Flow (including the selling price) and this NPV is displayed in year 5. Optimal holding period can be estimated, using this method - when NPV is the highest. Please note that appreciation growth can change these numbers greatly. It sometimes makes sense to sell the property even before the end of the mortgage term.

Sign in to edit this report, add or compare properties. Don't have an acount? Sign up now!

BESbswy