Property Report: Commercial St FIX & FLIP
Property Report :
Commercial St
47827 Commercial St, Oakridge, OR 97463

Powered by
Real Estate Analysis
![]()
Created on: Apr 16, 2025
Author: Robert Grand
Company: Grand Real Estate Investment
Executive Summary
47827 Commercial St, Oakridge, OR 97463
Singlefamily: 3 bedrooms , 1 bathroom
Year built: 1950, Size: 1216 SF
Investment strategy: Fix and Flip

Investment Summary
| After Repair Value | $ 249,900 |
| Calculated Project Profit | $ 24,106 |
| 78.83 % | |
| Return on Investment | 25.10 % |
| Project Term | 8 months |
Financial Breakdown
| $ 218,047 | |
| Financing | $ 122,000 |
| $ 96,047 |
Project Cost Breakdown
| Purchase Costs | |
|---|---|
| Purchase Price | $ 122,000 |
| Buying Costs | $ 2,500 |
| Total | $ 124,500 |
| Repair Costs | |
|---|---|
| Repair Costs Lump Sum | $ 75,000 |
| Total | $ 75,000 |
| Holding Costs | |
|---|---|
| Monthly Holding Costs | $ 1,200 |
| Monthly Loan Payments (interest) | $ 1,118 |
| Total Months Held | 8 |
| Total | $ 18,547 |
| Selling Costs | |
|---|---|
| Commissions (2.5%) | $ 6,248 |
| Selling Costs | $ 1,500 |
| Total | $ 7,748 |
Property Description
47827 Commercial St, Oakridge, OR 97463 is a single family home built in 1950. This property was last sold for $65,000 in 2011 and currently has an estimated value of $232,200. According to the Oakridge public records, the property at 47827 Commercial St, Oakridge, OR 97463 has approximately 1216 square feet, 2 beds and 1 baths. Nearby schools include Oakridge Junior High School, Oakridge Elementary School and Oakridge High School.
| Purchase Price | $ 122,000 |
| Address | 47827 Commercial St , Oakridge, 97463, OR |
| Listing Agent | Sandy Price |
| Listing Broker | Town & Country, Realtors, Inc |
| Year Built | 1950 |
| Type | Singlefamily |
| Size | 1216 SF |
| Bedrooms | 3 |
| Bathrooms | 1 |

Property History
| Date | Price | Change | Event |
|---|---|---|---|
| 5/3/2011 | |||
| 1/21/2011 | |||
| 7/16/2003 | |||
| 1/1/2001 | |||
| 1/1/1999 | |||
| 8/16/1994 | |||
| 8/18/1992 |
Comparative Sales Analysis
-
$ 249,900
Property ARV
-
Singlefamily
Bldg type
-
1,216
SqFt
-
$ 206
per SqFt
-
3
Beds
-
1
Baths
Financial Analysis
Financing Overview
Cash Flow Forecast
Resale Analysis
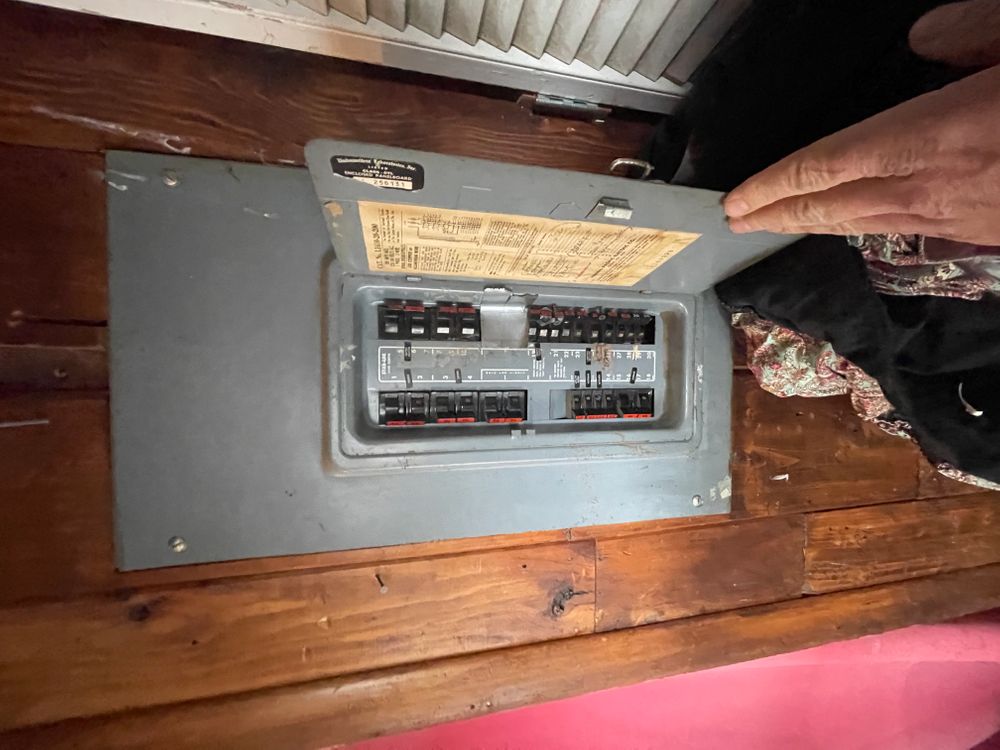
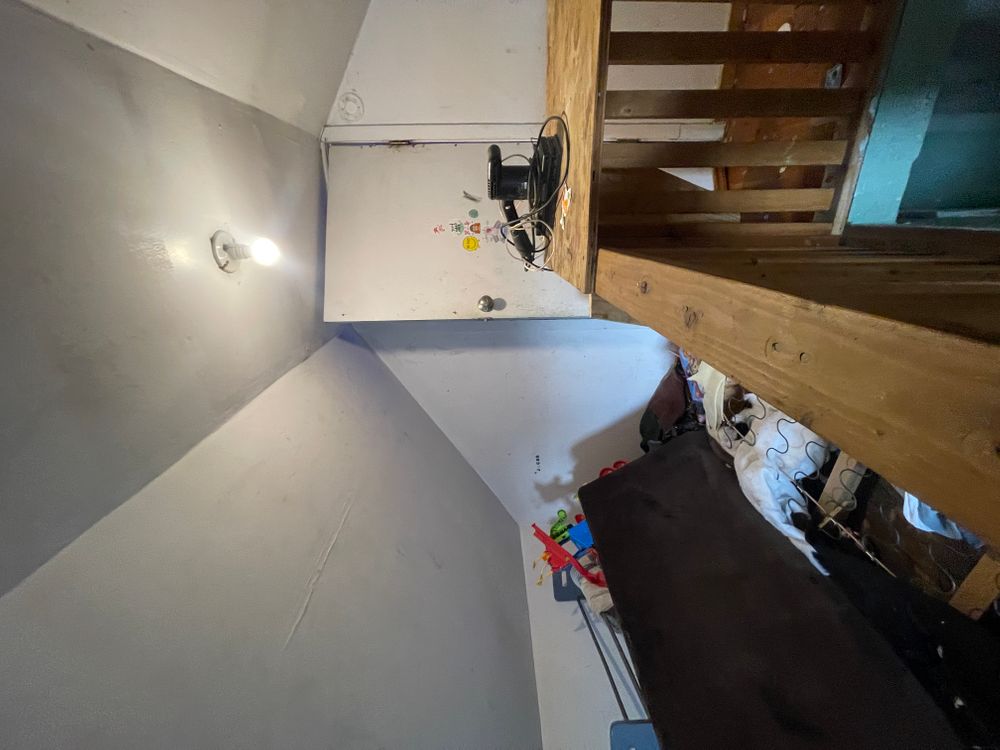
Photos


Sign in to edit this report, add or compare properties. Don't have an acount? Sign up now!