Modern & Main Real Estate
350 E. 400 S
Salt Lake City, UT, 84111

Property Report: 4633 S Quail Vista Lane Ln Unit G, Salt Lake City RENTAL

Property Report :

4633 S Quail Vista Lane Ln Unit G, Salt Lake City, UT 84117

Created on: Apr 15, 2025

Author: Modern & Main Real Estate

Company: Modern & Main Real Estate

4633 S Quail Vista Lane Ln Unit G, Salt Lake City, UT 84117

Condominium: 2 bedrooms , 2 bathrooms

Year built: 1978, Size: 860 SF

Investment strategy: Rental Property

Purchase Price$ 294,900
Rent$ 1,800/mo
Monthly Cash Flow$ 225
Cash on Cash Return2.14 %

Financial Analysis

Cash on Cash Return 2.14 %
Internal Rate of Return (IRR) 8.69 %
Capitalization Rate 5.47 %
Gross Rent Multiplier (GRM) 13.65
Debt-coverage Ratio (DCR) 1.20
Operating Expense Ratio (OER) 25.36 %

Financial Breakdown

Purchase Price $ 294,900
Purchase Costs $ 8,000
Repair/Construction Costs $ 0
Total Capital Needed
$ 302,900
Financing $ 176,940
Total Cash Needed
$ 125,960
Cash at Closing
$ 117,960
Cash During Rehab
$ 8,000

Operating Analysis

Rent $ 1,800/mo
Gross Operating Income (GOI) $ 21,600
Total Expenses $ 5,478
Net Operating Income (NOI) $ 16,122
Annual Debt Service $ 13,421
Cash Flow Before Taxes (CFBT) $ 2,701
Income Tax Liability $ -975
Cash Flow After Taxes (CFAT) $ 3,676

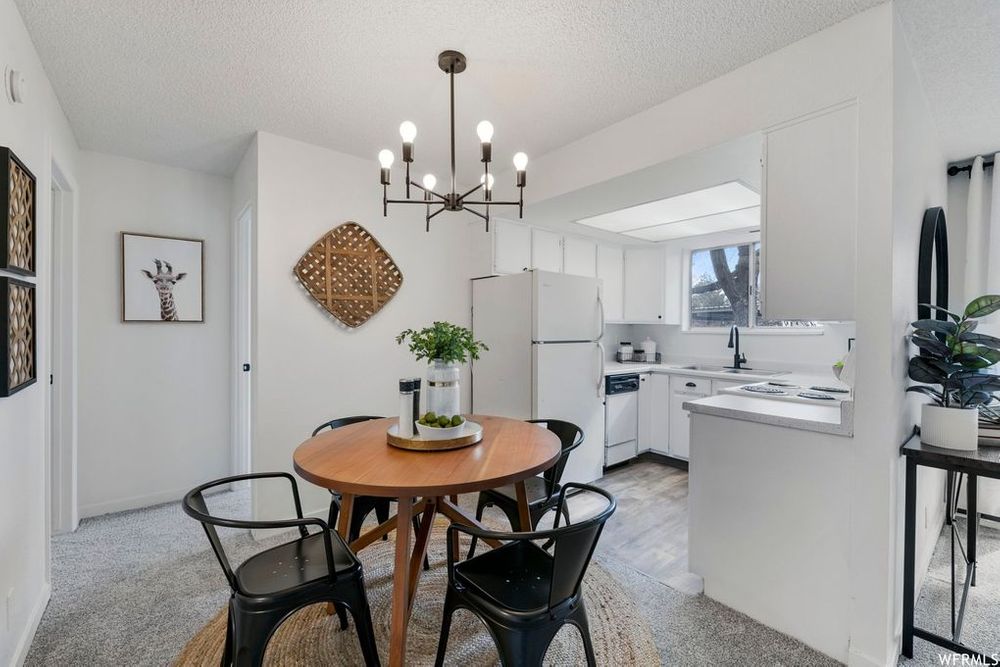
Fall in love with the tree-lined lane that leads to the coveted Quailbrook East Community. Beautifully remodeled with new paint, carpet, base, and LED lighting. Large bedrooms and 2 bathrooms. Conveniently located on the ground floor, with sliding doors out to your private patio. Private laundry with extra storage space. 2 assigned parking spaces. Quailbrook boasts multiple ponds, 2 swimming pools, sauna, exercise room, tennis, basketball, and clubhouse and beautiful towering trees. Centrally located in the highly desirable Holladay/Millcreek area minutes away from the freeway, UofU, downtown and ski areas. Easy to show, and shows beautifully. owner/agent

Purchase Price $ 294,900
Address 4633 S Quail Vista Lane Ln Unit G , Salt Lake City, 84117, UT
MLS® # 1862574
Listing Agent Anne Seal
Listing Broker KW Utah Realtors Keller Williams
Year Built 1978
Type Condominium
Size 860 SF
Bedrooms 2
Bathrooms 2

Annual Property Operating Data

Incomes % of GOI
Gross Scheduled Income
$ 21,600    
Total Gross Income $ 21,600  
Vacancy loss
$ 0  
Gross Operating Income
$ 21,600 100.00 %
Expenses
Insurance $ 700 3.24 %
Property tax $ 1,598 7.40 %
Association fees $ 3,180 14.72 %
Total Expenses $ 5,478 25.36 %
Net Operating Income
$ 16,122 74.64 %
JavaScript chart by amCharts 3.20.13
JavaScript chart by amCharts 3.20.13CFBT Loan paymentInsuranceProperty taxAssociation fees

Cash Flow (Year 1)

Net Operating Income $ 16,122 74.64 %
Annual Debt Service $ 13,421 62.13 %
Cash Flow Before Taxes (CFBT)
$ 2,701 12.51 %
Income Tax Liability $ -975 -4.51 %
Cash Flow After Taxes (CFAT)
$ 3,676 17.02 %

Operating Ratios

Operating Expense Ratio
25.36 %
Break-Even Ratio
87.49 %

Financial Measures

Net Present Value
$ 45,857
Internal Rate of Return
8.69 %
Profitability Index
1.36
Annual Depreciation $ 8,579

Holding period of 10 years and discount rate of 5.00% were used for calculation of NPV and IRR. The rest of the financial measures are for the 1st year only and therefore don't provide such an exact information.

Investment Return Ratios

Cash on Cash Return
2.14 %
Return on Investment
9.17 %
Capitalization Rate
5.47 %
Gross Rental Yield
7.32 %
Gross Rent Multiplier
13.65
Financing
Down Payment $ 117,960
Loan $ 176,940
Loan to Value Ratio
60.00 %
Loan to Cost Ratio
60.00 %
Debt Coverage Ratio 1.20
Loan

Financing of: Purchase price ($ 294,900)

Type Amortized
Loan Amount $ 176,940
Down payment (40%) $ 117,960
Amortization 30 years
Interest Rate 6.50 %
Monthly Payment $ 1,118.38
JavaScript chart by amCharts 3.20.13
JavaScript chart by amCharts 3.20.13Down Payment LoanCash During Rehab
JavaScript chart by amCharts 3.20.13
JavaScript chart by amCharts 3.20.13Loan Principal Balance Equity: Principal Paid Equity: Cash Outlay Equity: Appreciation

This chart shows the process of accumulation of investor's equity. There is some equity created right at the beginning with the rehab/construction and later investor's equity is rising by paying off the principal of the loan and also by appreciation over the years. All the green parts is the cummulative equity belonging to the investor and the red part belongs to the lender.

Year 012345678910
Operational Analysis
Gross Scheduled Income 0 21,600 22,032 22,473 22,922 23,381 23,848 24,325 24,812 25,308 25,814
Vacancy Loss 0 0 0 0 0 0 0 0 0 0 0
Gross Operating Income 0 21,600 22,032 22,473 22,922 23,381 23,848 24,325 24,812 25,308 25,814
Expenses 0 5,478 5,588 5,699 5,813 5,930 6,048 6,169 6,293 6,418 6,547
Net Operating Income 0 16,122 16,444 16,773 17,109 17,451 17,800 18,156 18,519 18,889 19,267
Loan Payment 0 13,421 13,421 13,421 13,421 13,421 13,421 13,421 13,421 13,421 13,421
Payment Interest Part 0 11,443 11,310 11,169 11,018 10,857 10,686 10,503 10,307 10,099 9,876
Payment Principal Part 0 1,978 2,110 2,251 2,402 2,563 2,735 2,918 3,113 3,322 3,544
Cash Flow
Repairs/Construction 0 0 0 0 0 0 0 0 0 0 0
Cash Flow Before Taxes -125,960 2,701 3,024 3,353 3,688 4,030 4,379 4,735 5,099 5,469 5,847
Depreciation 0 8,579 8,579 8,579 8,579 8,579 8,579 8,579 8,579 8,579 8,579
Taxes 0 -975 -861 -744 -622 -496 -366 -231 -92 53 203
Cash Flow After Taxes -125,960 3,676 3,885 4,096 4,310 4,527 4,746 4,967 5,190 5,416 5,644

Note: All amounts in the table above are in $

JavaScript chart by amCharts 3.20.13
JavaScript chart by amCharts 3.20.13GOINOICFBTCFAT

Resale Price Evaluation Methods

The property is sold after 10 years. Below is the resale price calculated using different methods.

Appreciation (3.00%) $ 396,321
Cap Rate (5.47%) & NOI $ 352,235
Gross Rent Multiplier $ 352,361

Sale Proceeds

Projected Selling Price $ 396,321
Costs of Sale (6.00%) $ 23,779
1. Loan Balance Payoff $ 150,003
Net Sale Proceeds Before Tax $ 222,539

In the resale analysis we do not include any calculation for taxes that might be owed on sale of the property. The tax laws for the resale are rather complex and subjected to frequent changes.

Net Assets and Yield

Net Assets
Sale Proceeds Before Tax $ 222,539
Investor Cash Outlay $ 125,960
Net Assets $ 96,579
Average Yield
Annual Net Assets $ 9,658
Average Cash Flow (After Taxes) $ 4,081
Average Annual Gain (After Taxes) $ 13,739
Average Annual Yield (After Taxes) 4.66 %
JavaScript chart by amCharts 3.20.13

This charts shows Net Present Value (NPV) when property is sold in various years, i.e. when sold in 5th year, the NPV is calculated from 5 years of Cash Flow (including the selling price) and this NPV is displayed in year 5. Optimal holding period can be estimated, using this method - when NPV is the highest. Please note that appreciation growth can change these numbers greatly. It sometimes makes sense to sell the property even before the end of the mortgage term.

Sign in to edit this report, add or compare properties. Don't have an acount? Sign up now!

BESbswy