Keller Williams Seven Hills

Cincinnati Ohio
PRESENTED BY LISA WILLIAMS REALTOR

Property Report: WARNER RENTAL

Property Report :

WARNER

447 Warner St, Cincinnati, OH 45219

Created on: Apr 16, 2025

Author: Lisa WIlliams

Company: Keller Williams Seven Hills

447 Warner St, Cincinnati, OH 45219

Multifamily:

Year built: 1890, Size: 2958 SF

Investment strategy: Rental Property

Purchase Price$ 330,000
Rent$ 2,340/mo
Monthly Cash Flow$ 353
Cash on Cash Return8.36 %

Financial Analysis

Cash on Cash Return 8.36 %
Internal Rate of Return (IRR) 20.75 %
Capitalization Rate 6.01 %
Gross Rent Multiplier (GRM) 11.75
Debt-coverage Ratio (DCR) 1.27
Operating Expense Ratio (OER) 27.14 %

Financial Breakdown

Purchase Price $ 330,000
Purchase Costs $ 1,200
Repair/Construction Costs $ 0
Total Capital Needed
$ 331,200
Financing $ 280,500
Total Cash Needed
$ 50,700
Cash at Closing
$ 49,500
Cash During Rehab
$ 1,200

Operating Analysis

Rent $ 2,340/mo
Gross Operating Income (GOI) $ 27,238
Total Expenses $ 7,392
Net Operating Income (NOI) $ 19,846
Annual Debt Service $ 15,608
Cash Flow Before Taxes (CFBT) $ 4,238
Income Tax Liability $ -53
Cash Flow After Taxes (CFAT) $ 4,291

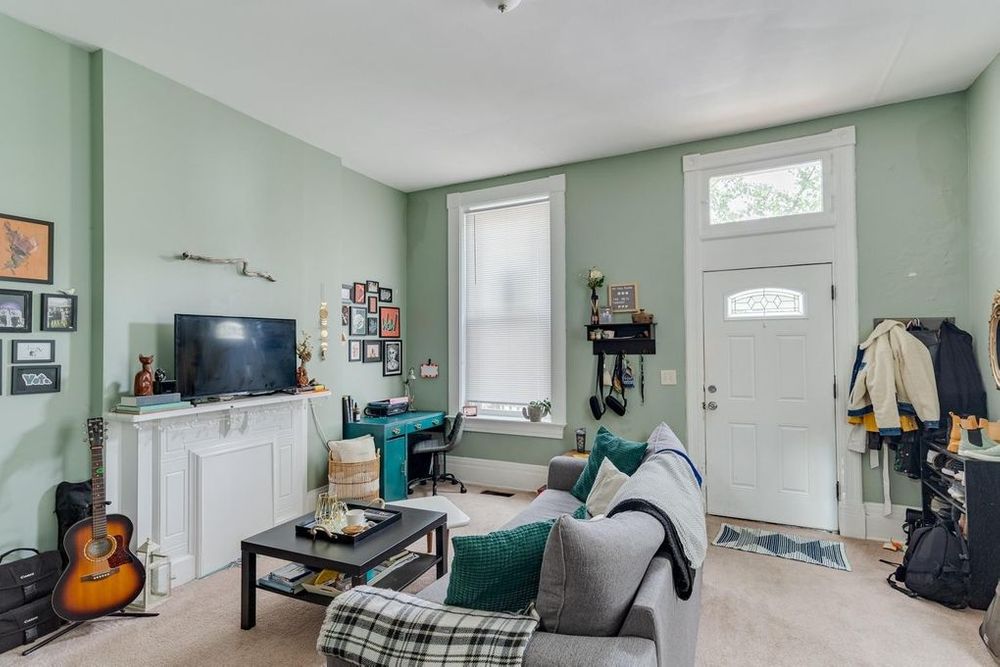
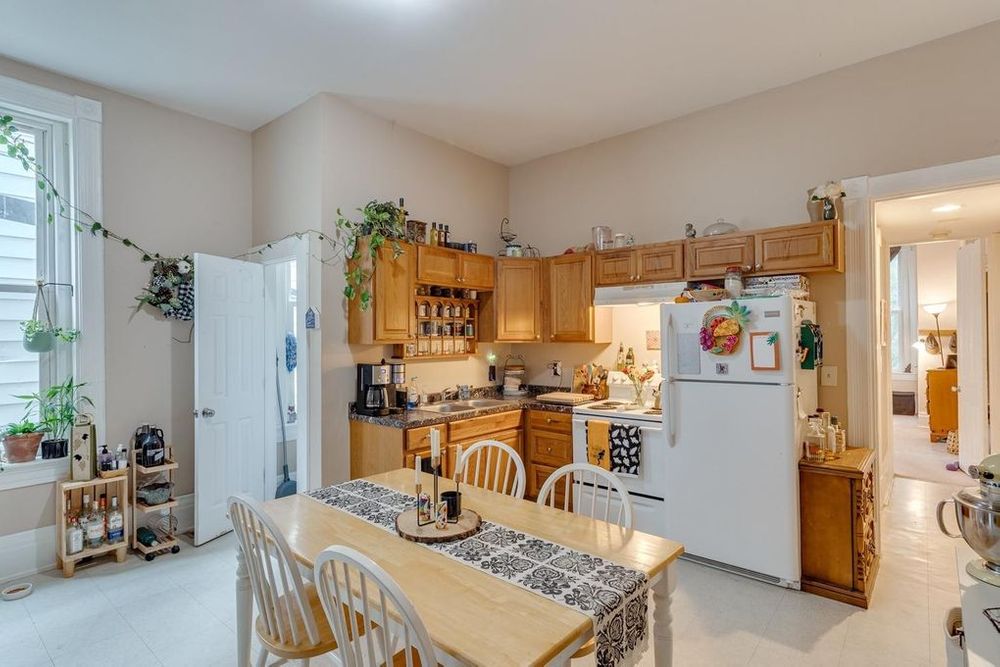
Very well-maintained Triplex in Clifton Heights! 3, 1 bedroom units. All utilities are separate and paid for by the tenants. Laundry hookups. Vinyl replacement windows. Great location to own a rental property with good income and appreciation.

Purchase Price $ 330,000
Address 447 Warner St , Cincinnati, 45219, OH
MLS® # 1720513
Listing Agent Jason Kunkel
Listing Broker Kopf Hunter Haas
Year Built 1890
Type Multifamily
Number of Units
Size 2958 SF

Property History

Date Price Change Event
8/30/2017
9/17/2012
5/6/1993
1/4/1989
10/2/1985

Annual Property Operating Data

Incomes % of GOI
Gross Scheduled Income
$ 28,080    
Total Gross Income $ 28,080  
Vacancy loss
$ 842  
Gross Operating Income
$ 27,238 100.00 %
Expenses
Utilities GAS/ELECT WATER $ 1,776 6.52 %
Property tax $ 4,620 16.96 %
Insurance $ 996 3.66 %
Total Expenses $ 7,392 27.14 %
Net Operating Income
$ 19,846 72.86 %
JavaScript chart by amCharts 3.20.13

Cash Flow (Year 1)

Net Operating Income $ 19,846 72.86 %
Annual Debt Service $ 15,608 57.30 %
Cash Flow Before Taxes (CFBT)
$ 4,238 15.56 %
Income Tax Liability $ -53 -0.20 %
Cash Flow After Taxes (CFAT)
$ 4,291 15.75 %

Operating Ratios

Operating Expense Ratio
27.14 %
Break-Even Ratio
84.44 %

Financial Measures

Net Present Value
$ 112,006
Internal Rate of Return
20.75 %
Profitability Index
3.21
Annual Depreciation $ 9,600

Holding period of 10 years and discount rate of 5.00% were used for calculation of NPV and IRR. The rest of the financial measures are for the 1st year only and therefore don't provide such an exact information.

Investment Return Ratios

Cash on Cash Return
8.36 %
Return on Investment
27.89 %
Capitalization Rate
6.01 %
Gross Rental Yield
8.51 %
Gross Rent Multiplier
11.75
Financing
Down Payment $ 49,500
Loan $ 280,500
Loan to Value Ratio
85.00 %
Loan to Cost Ratio
85.00 %
Debt Coverage Ratio 1.27
Loan

Financing of: Purchase price ($ 330,000)

Type Amortized
Loan Amount $ 280,500
Down payment (15%) $ 49,500
Amortization 30 years
Interest Rate 3.76 %
Monthly Payment $ 1,300.63
JavaScript chart by amCharts 3.20.13

This chart shows the process of accumulation of investor's equity. There is some equity created right at the beginning with the rehab/construction and later investor's equity is rising by paying off the principal of the loan and also by appreciation over the years. All the green parts is the cummulative equity belonging to the investor and the red part belongs to the lender.

Year 012345678910
Operational Analysis
Gross Scheduled Income 0 28,080 28,642 29,214 29,799 30,395 31,003 31,623 32,255 32,900 33,558
Vacancy Loss 0 842 859 876 894 912 930 949 968 987 1,007
Gross Operating Income 0 27,238 27,782 28,338 28,905 29,483 30,072 30,674 31,287 31,913 32,551
Expenses 0 7,392 7,540 7,691 7,844 8,001 8,161 8,325 8,491 8,661 8,834
Net Operating Income 0 19,846 20,243 20,647 21,060 21,482 21,911 22,349 22,796 23,252 23,717
Loan Payment 0 15,608 15,608 15,608 15,608 15,608 15,608 15,608 15,608 15,608 15,608
Payment Interest Part 0 10,459 10,262 10,057 9,845 9,624 9,396 9,158 8,911 8,655 8,389
Payment Principal Part 0 5,149 5,346 5,550 5,763 5,983 6,212 6,450 6,696 6,953 7,219
Cash Flow
Repairs/Construction 0 0 0 0 0 0 0 0 0 0 0
Cash Flow Before Taxes -50,700 4,238 4,635 5,040 5,453 5,874 6,304 6,742 7,189 7,645 8,110
Depreciation 0 9,600 9,600 9,600 9,600 9,600 9,600 9,600 9,600 9,600 9,600
Taxes 0 -53 95 248 404 564 729 898 1,071 1,249 1,432
Cash Flow After Taxes -50,700 4,291 4,540 4,792 5,049 5,310 5,575 5,844 6,117 6,395 6,678

Note: All amounts in the table above are in $

JavaScript chart by amCharts 3.20.13

Resale Price Evaluation Methods

The property is sold after 10 years. Below is the resale price calculated using different methods.

Appreciation (3.00%) $ 443,492
Cap Rate (6.01%) & NOI $ 394,631
Gross Rent Multiplier $ 394,309

Sale Proceeds

Projected Selling Price $ 443,492
Costs of Sale (6.00%) $ 26,610
1. Loan Balance Payoff $ 219,180
Net Sale Proceeds Before Tax $ 197,703

In the resale analysis we do not include any calculation for taxes that might be owed on sale of the property. The tax laws for the resale are rather complex and subjected to frequent changes.

Net Assets and Yield

Net Assets
Sale Proceeds Before Tax $ 197,703
Investor Cash Outlay $ 50,700
Net Assets $ 147,003
Average Yield
Annual Net Assets $ 14,700
Average Cash Flow (After Taxes) $ 4,791
Average Annual Gain (After Taxes) $ 19,492
Average Annual Yield (After Taxes) 5.91 %
JavaScript chart by amCharts 3.20.13

This charts shows Net Present Value (NPV) when property is sold in various years, i.e. when sold in 5th year, the NPV is calculated from 5 years of Cash Flow (including the selling price) and this NPV is displayed in year 5. Optimal holding period can be estimated, using this method - when NPV is the highest. Please note that appreciation growth can change these numbers greatly. It sometimes makes sense to sell the property even before the end of the mortgage term.

Sign in to edit this report, add or compare properties. Don't have an acount? Sign up now!

BESbswy