A.M. S Real Estate Holdings
380 Nathaniel Howard RD
Suite 1001

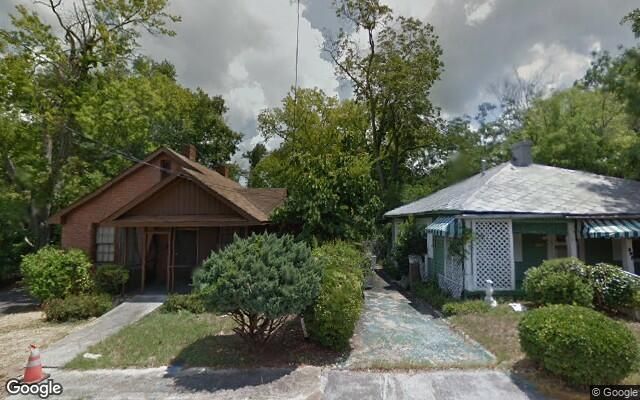
Property Report: 395 Grant Ave, Macon RENTAL

Property Report :

395 Grant Ave, Macon, GA 31201

Created on: Jul 29, 2025

Author: Michael Stephens

Company: A.M. S Real Estate Holdings

395 Grant Ave, Macon, GA 31201

Singlefamily: 4 bedrooms , 1.5 bathrooms

Year built: 1960, Size: 2947 SF

Investment strategy: Rental Property

Purchase Price$ 74,496
Rent$ 950/mo
Monthly Cash Flow$ 931
Cash on Cash Return12.08 %

Financial Analysis

Cash on Cash Return 12.08 %
Internal Rate of Return (IRR) 14.71 %
Capitalization Rate 11.40 %
Gross Rent Multiplier (GRM) 8.60
Debt-coverage Ratio (DCR) 0.00
Operating Expense Ratio (OER) 0.00 %
After Repair Value $ 98,000
Profit/Equity From Rehab $ 5,504

Financial Breakdown

Purchase Price $ 74,496
Purchase Costs $ 3,000
Repair/Construction Costs $ 15,000
Total Capital Needed
$ 92,496
Financing $ 0
Total Cash Needed
$ 92,496
Cash at Closing
$ 0
Cash During Rehab
$ 92,496

Operating Analysis

Rent $ 950/mo
Gross Operating Income (GOI) $ 11,172
Total Expenses $ 0
Net Operating Income (NOI) $ 11,172
Annual Debt Service $ 0
Cash Flow Before Taxes (CFBT) $ 11,172
Income Tax Liability $ 2,251
Cash Flow After Taxes (CFAT) $ 8,921
Purchase Price $ 74,496
Address 395 Grant Ave , Macon, 31201, GA
Year Built 1960
Type Singlefamily
Size 2947 SF
Bedrooms 4
Bathrooms 1.5

Annual Property Operating Data

Incomes % of GOI
Gross Scheduled Income
$ 11,400    
Total Gross Income $ 11,400  
Vacancy loss
$ 228  
Gross Operating Income
$ 11,172 100.00 %
Expenses
Total Expenses $ 0 0.00 %
Net Operating Income
$ 11,172 100.00 %
JavaScript chart by amCharts 3.20.13

Cash Flow (Year 1)

Net Operating Income $ 11,172 100.00 %
Annual Debt Service $ 0 0.00 %
Cash Flow Before Taxes (CFBT)
$ 11,172 100.00 %
Income Tax Liability $ 2,251 20.15 %
Cash Flow After Taxes (CFAT)
$ 8,921 79.85 %

Operating Ratios

Operating Expense Ratio
0.00 %
Break-Even Ratio
0.00 %

Financial Measures

Net Present Value
$ 277,652
Internal Rate of Return
14.71 %
Profitability Index
4.00
Annual Depreciation $ 2,167

Holding period of 30 years and discount rate of 5.00% were used for calculation of NPV and IRR. The rest of the financial measures are for the 1st year only and therefore don't provide such an exact information.

Investment Return Ratios

Cash on Cash Return
12.08 %
Return on Investment
16.91 %
Capitalization Rate
11.40 %
Gross Rental Yield
15.30 %
Gross Rent Multiplier
8.60

There is no financing selected in this deal.

JavaScript chart by amCharts 3.20.13

This chart shows the process of accumulation of investor's equity. There is some equity created right at the beginning with the rehab/construction and later investor's equity is rising by paying off the principal of the loan and also by appreciation over the years. All the green parts is the cummulative equity belonging to the investor and the red part belongs to the lender.

Year 0123456789101112131415161718192021222324252627282930
Operational Analysis
Gross Scheduled Income 0 11,400 11,970 12,569 13,197 13,857 14,550 15,277 16,041 16,843 17,685 18,569 19,498 20,473 21,496 22,571 23,700 24,885 26,129 27,435 28,807 30,248 31,760 33,348 35,015 36,766 38,604 40,535 42,561 44,689 46,924
Vacancy Loss 0 228 239 251 264 277 291 306 321 337 354 371 390 409 430 451 474 498 523 549 576 605 635 667 700 735 772 811 851 894 939
Gross Operating Income 0 11,172 11,731 12,317 12,933 13,580 14,259 14,972 15,720 16,506 17,331 18,198 19,108 20,063 21,066 22,120 23,226 24,387 25,606 26,887 28,231 29,643 31,125 32,681 34,315 36,031 37,832 39,724 41,710 43,796 45,985
Expenses 0 0 0 0 0 0 0 0 0 0 0 0 0 0 0 0 0 0 0 0 0 0 0 0 0 0 0 0 0 0 0
Net Operating Income 0 11,172 11,731 12,317 12,933 13,580 14,259 14,972 15,720 16,506 17,331 18,198 19,108 20,063 21,066 22,120 23,226 24,387 25,606 26,887 28,231 29,643 31,125 32,681 34,315 36,031 37,832 39,724 41,710 43,796 45,985
Cash Flow
Repairs/Construction 15,000 0 0 0 0 0 0 0 0 0 0 0 0 0 0 0 0 0 0 0 0 0 0 0 0 0 0 0 0 0 0
Cash Flow Before Taxes -92,496 11,172 11,731 12,317 12,933 13,580 14,259 14,972 15,720 16,506 17,331 18,198 19,108 20,063 21,066 22,120 23,226 24,387 25,606 26,887 28,231 29,643 31,125 32,681 34,315 36,031 37,832 39,724 41,710 43,796 45,985
Depreciation 0 2,167 2,167 2,167 2,167 2,167 2,167 2,167 2,167 2,167 2,167 2,167 2,167 2,167 2,167 2,167 2,167 2,167 2,167 2,167 2,167 2,167 2,167 2,167 2,167 2,167 2,167 2,167 2,167 2,167 2,167
Taxes 0 2,251 2,391 2,538 2,692 2,853 3,023 3,201 3,388 3,585 3,791 4,008 4,235 4,474 4,725 4,988 5,265 5,555 5,860 6,180 6,516 6,869 7,239 7,629 8,037 8,466 8,916 9,389 9,886 10,407 10,955
Cash Flow After Taxes -92,496 8,921 9,340 9,780 10,241 10,726 11,236 11,770 12,332 12,921 13,540 14,190 14,873 15,589 16,342 17,132 17,961 18,832 19,747 20,707 21,715 22,774 23,885 25,053 26,278 27,565 28,916 30,335 31,824 33,388 35,031

Note: All amounts in the table above are in $

JavaScript chart by amCharts 3.20.13

Resale Price Evaluation Methods

The property is sold after 30 years. Below is the resale price calculated using different methods.

Appreciation (6.00%) $ 562,862
Cap Rate (11.40%) & NOI $ 403,381
Gross Rent Multiplier $ 403,546

Sale Proceeds

Projected Selling Price $ 562,862
Costs of Sale (6.00%) $ 33,772
Net Sale Proceeds Before Tax $ 529,090

In the resale analysis we do not include any calculation for taxes that might be owed on sale of the property. The tax laws for the resale are rather complex and subjected to frequent changes.

Net Assets and Yield

Net Assets
Sale Proceeds Before Tax $ 529,090
Investor Cash Outlay $ 92,496
Net Assets $ 436,594
Average Yield
Annual Net Assets $ 14,553
Average Cash Flow (After Taxes) $ 17,930
Average Annual Gain (After Taxes) $ 32,484
Average Annual Yield (After Taxes) 43.60 %
JavaScript chart by amCharts 3.20.13

This charts shows Net Present Value (NPV) when property is sold in various years, i.e. when sold in 5th year, the NPV is calculated from 5 years of Cash Flow (including the selling price) and this NPV is displayed in year 5. Optimal holding period can be estimated, using this method - when NPV is the highest. Please note that appreciation growth can change these numbers greatly. It sometimes makes sense to sell the property even before the end of the mortgage term.

Sign in to edit this report, add or compare properties. Don't have an acount? Sign up now!

BESbswy