{{ label }}

Real Estate Analysis

Property Report: 3905 IRELAND DR RENTAL
Property Report :
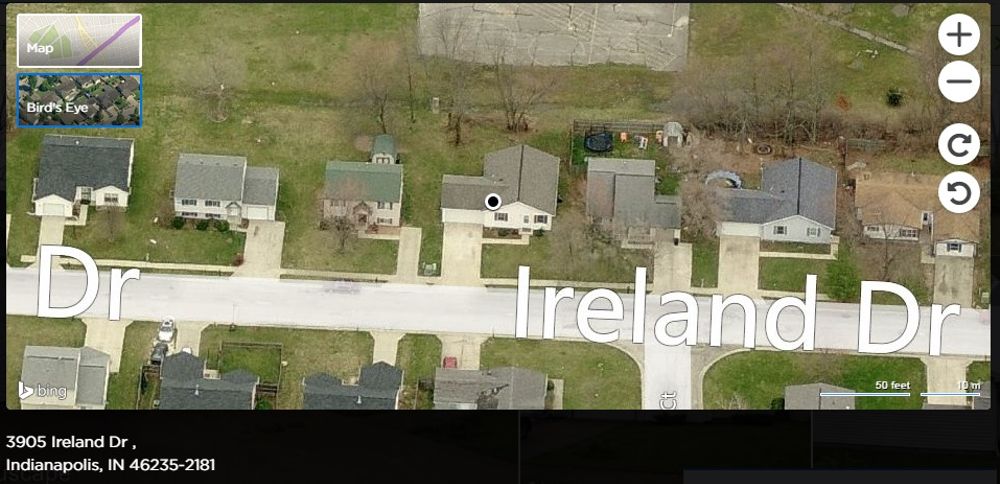
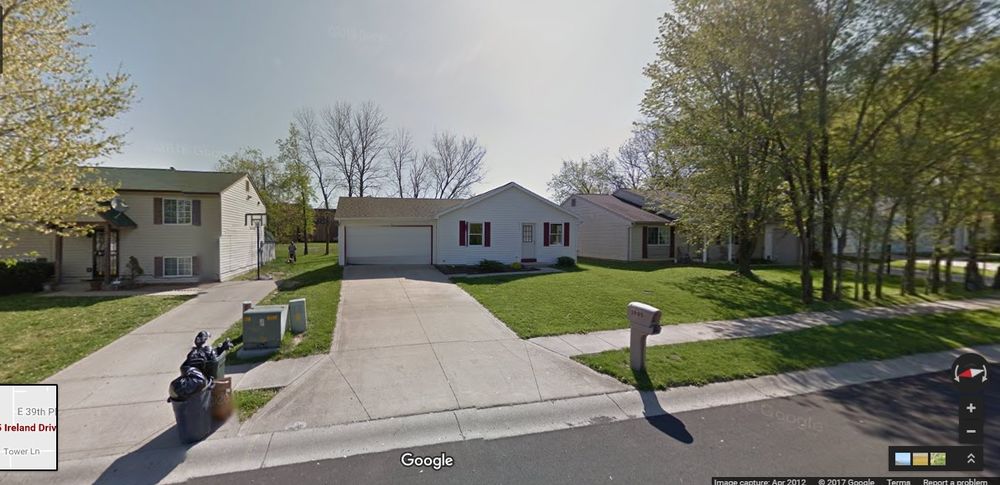
3905 IRELAND DR
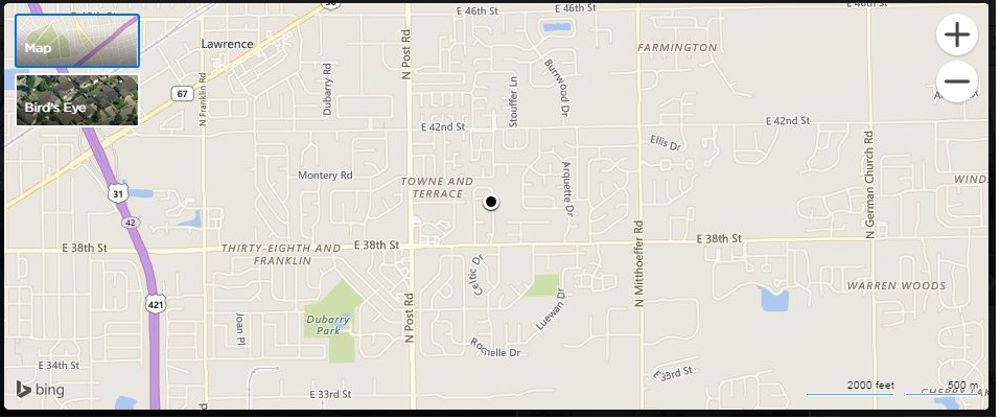
3905 Ireland Dr, Indianapolis, IN 46235
Powered by
Real Estate Analysis
Created on: Jul 30, 2025
Author: Sam Hathi
Executive Summary
3905 Ireland Dr, Indianapolis, IN 46235
Singlefamily: 3 bedrooms , 2 bathrooms
Year built: 2002, Size: 1064 SF
Investment strategy: Rental Property
Purchase Price$ 79,334
Rent$ 800/mo
Monthly Cash Flow$ 463
Cash on Cash Return6.87 %
Financial Analysis
| Cash on Cash Return | 6.87 % |
| Internal Rate of Return (IRR) | 9.49 % |
| Capitalization Rate | 7.00 % |
| Gross Rent Multiplier (GRM) | 8.26 |
| Debt-coverage Ratio (DCR) | 0.00 |
| Operating Expense Ratio (OER) | 37.80 % |
| After Repair Value | $ 79,334 |
Financial Breakdown
| Purchase Price | $ 79,334 |
| Purchase Costs | $ 1,500 |
| Repair/Construction Costs | $ 0 |
| $ 80,834 | |
| Financing | $ 0 |
| $ 80,834 | |
| $ 0 | |
| $ 80,834 |
Operating Analysis
| Rent | $ 800/mo |
| Gross Operating Income (GOI) | $ 8,928 |
| Total Expenses | $ 3,375 |
| Net Operating Income (NOI) | $ 5,553 |
| Annual Debt Service | $ 0 |
| Cash Flow Before Taxes (CFBT) | $ 5,553 |
| Income Tax Liability | $ 1,136 |
| Cash Flow After Taxes (CFAT) | $ 4,417 |
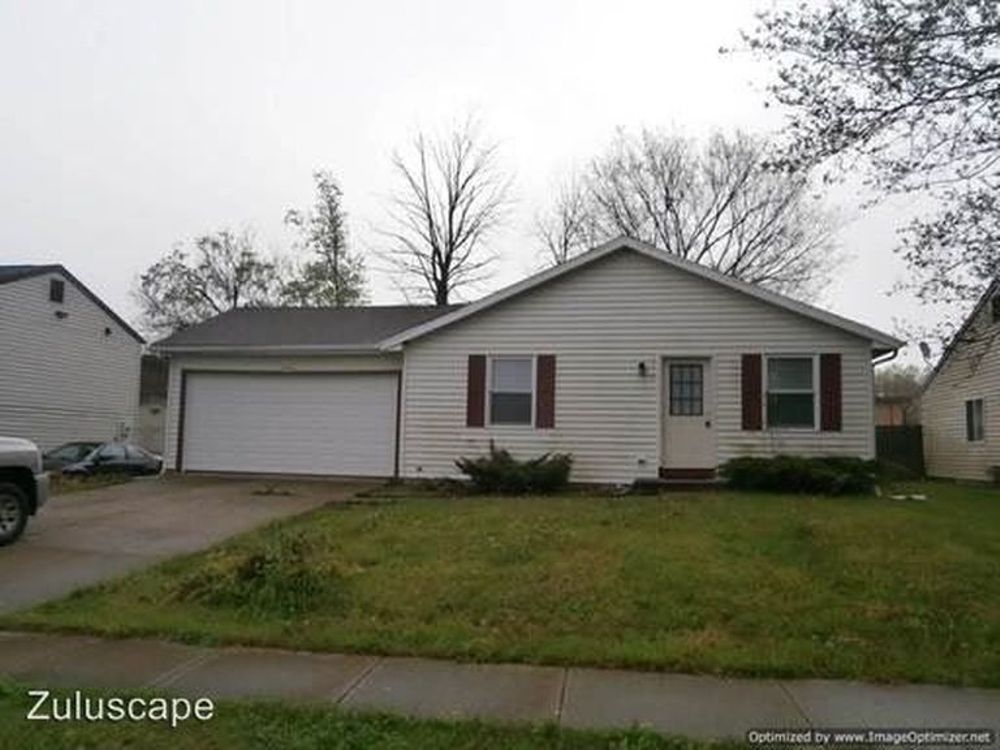
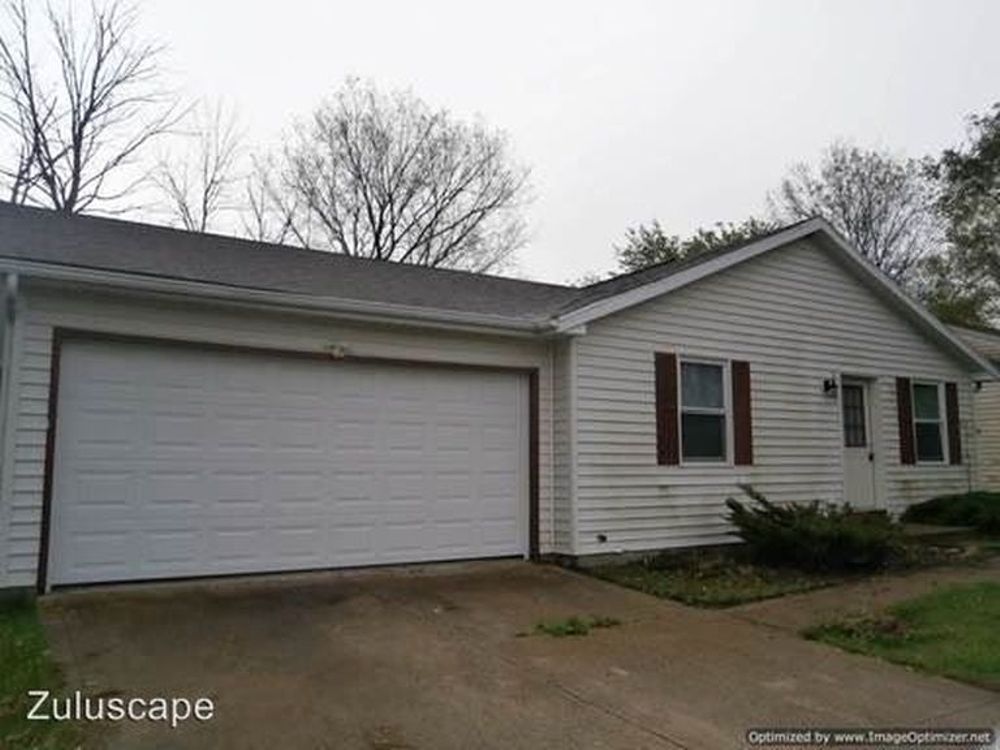
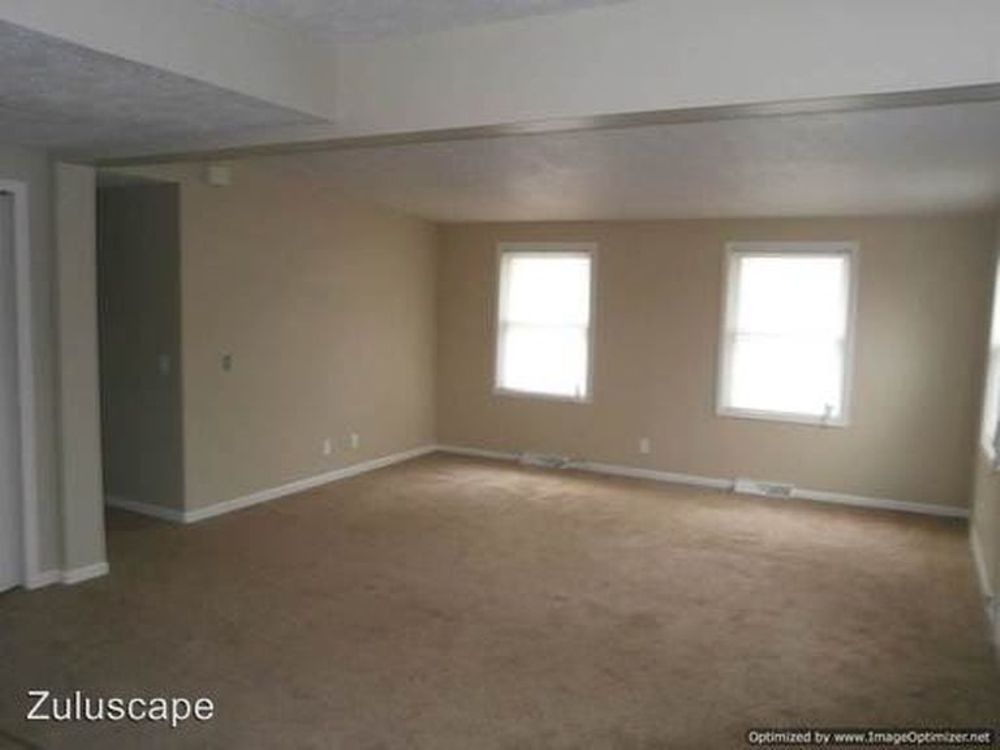
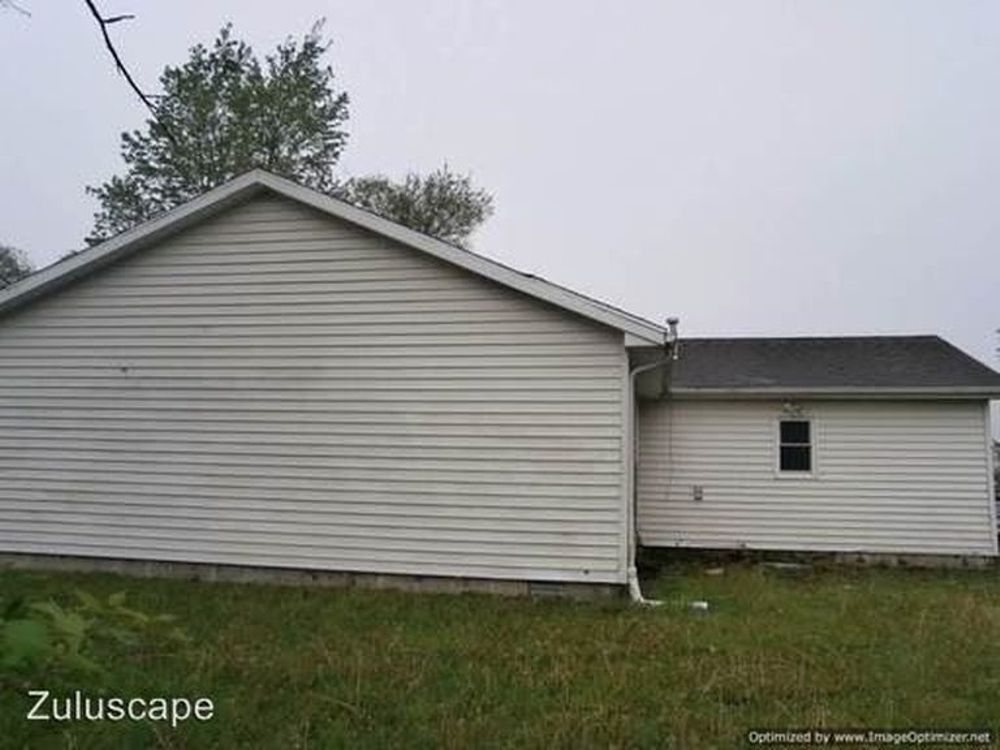
Property Description
3905 Ireland Dr Indianapolis, IN 46235
-
$ 79,334
Property ARV
-
Singlefamily
Bldg type
-
1,064
SqFt
-
$ 75
per SqFt
-
3
Beds
-
2
Baths
Operating Analysis
Financial Analysis
Financing Overview
Long-term Cash Flow Forecast
Resale Analysis
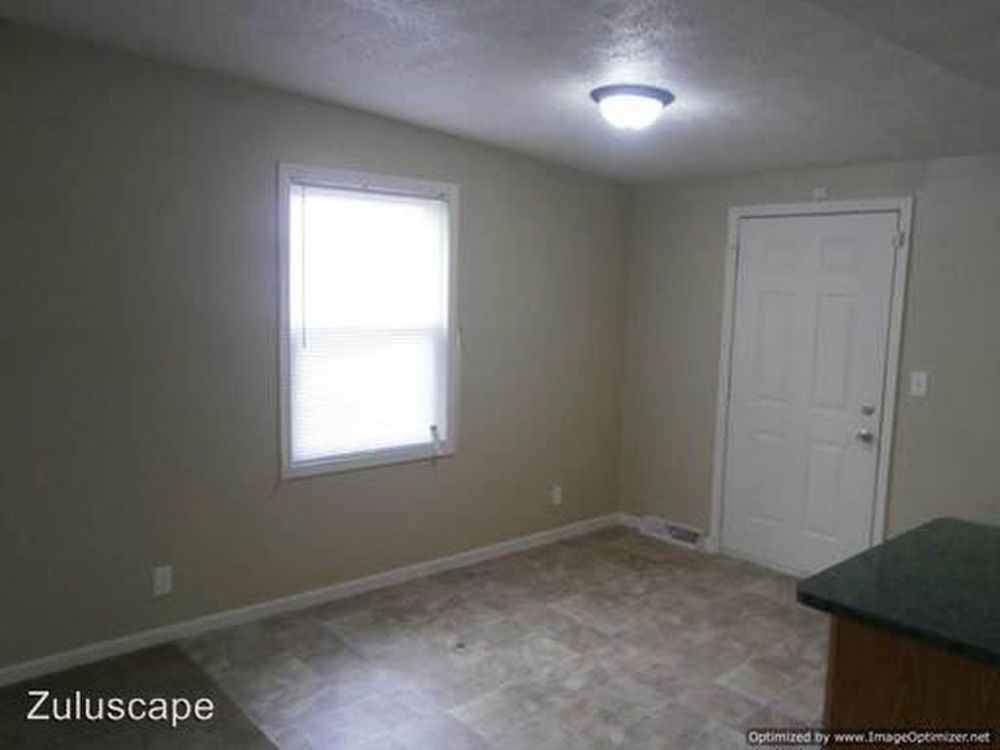
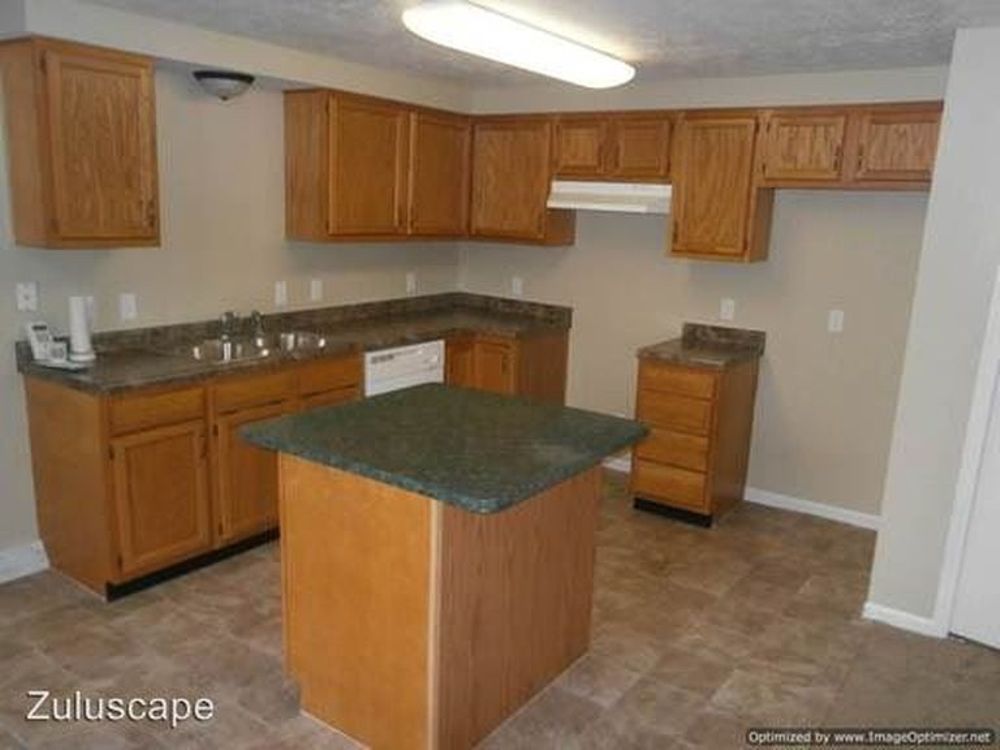
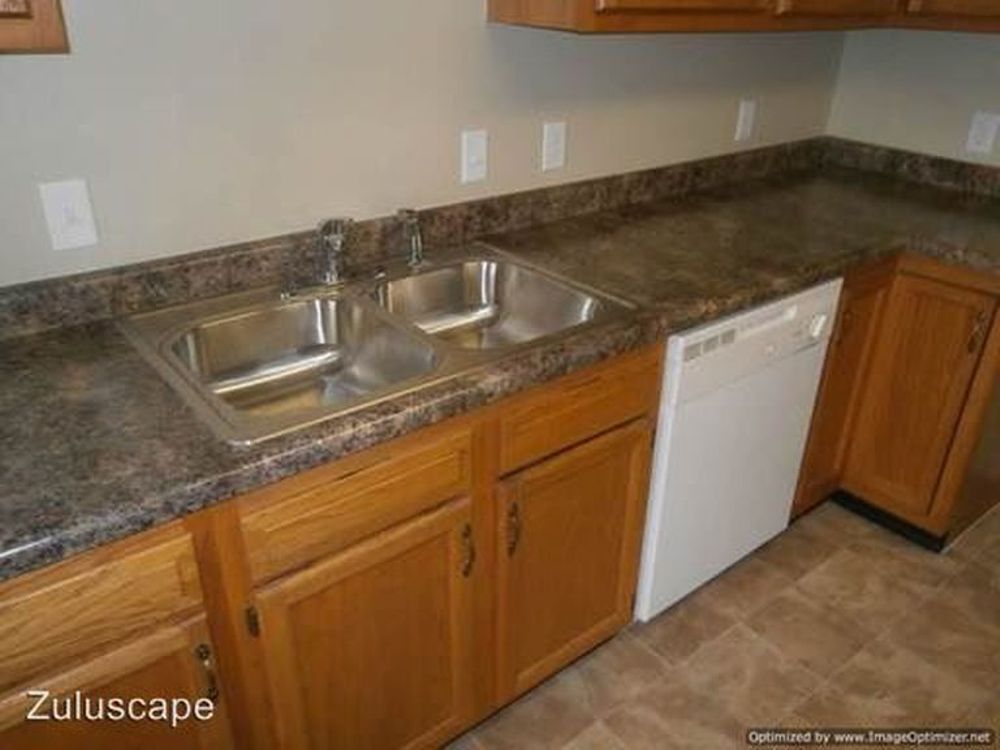
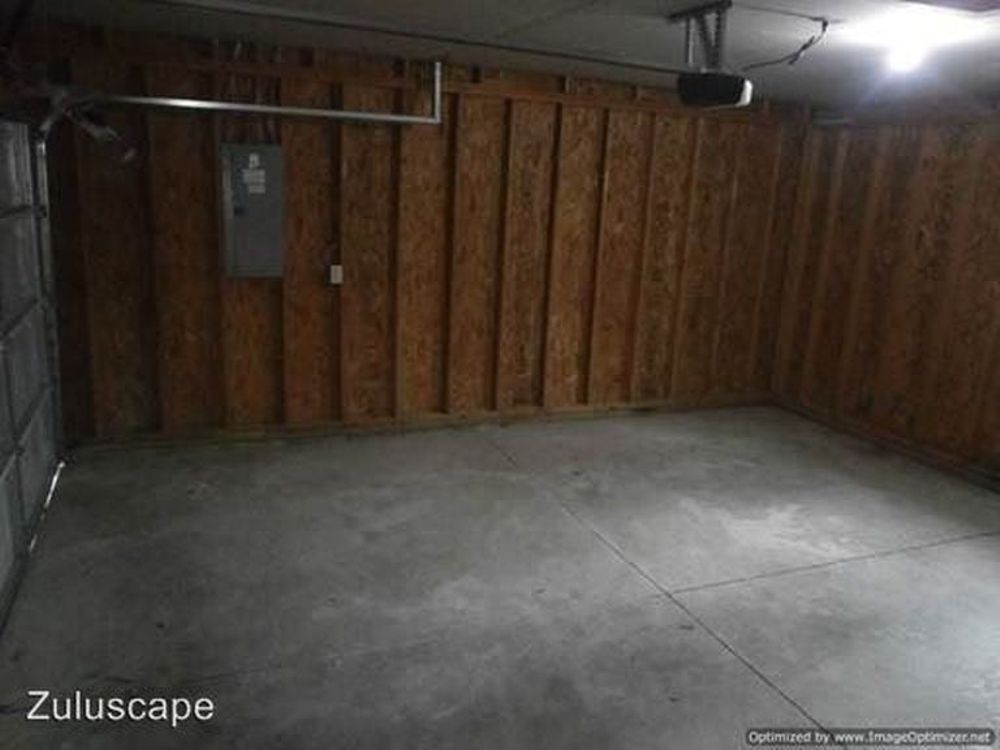
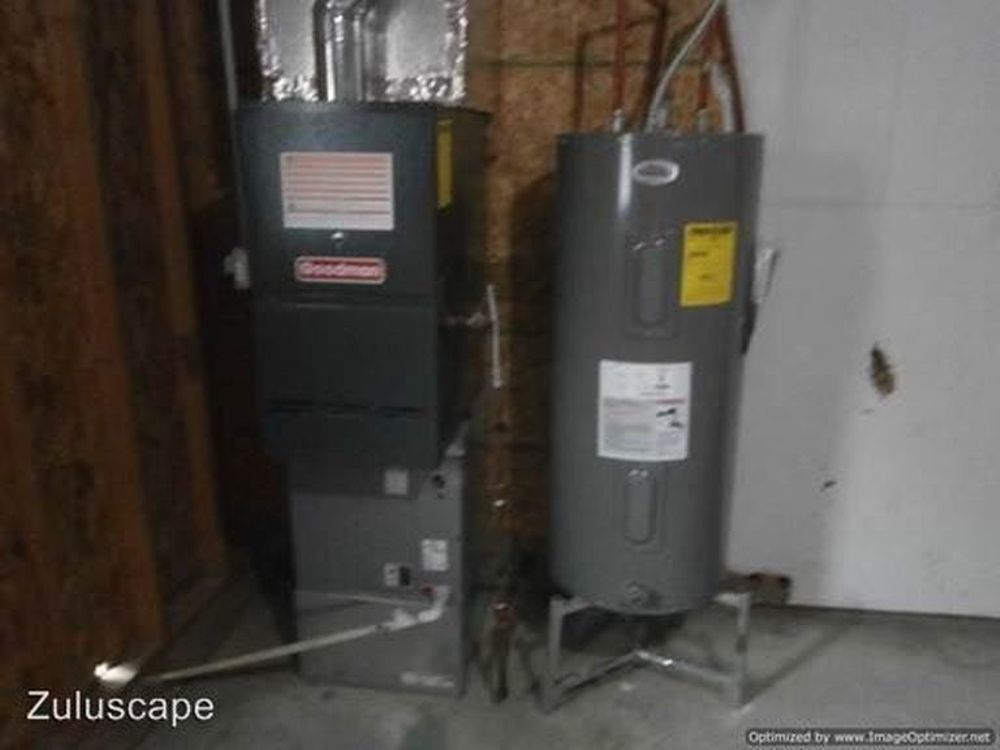
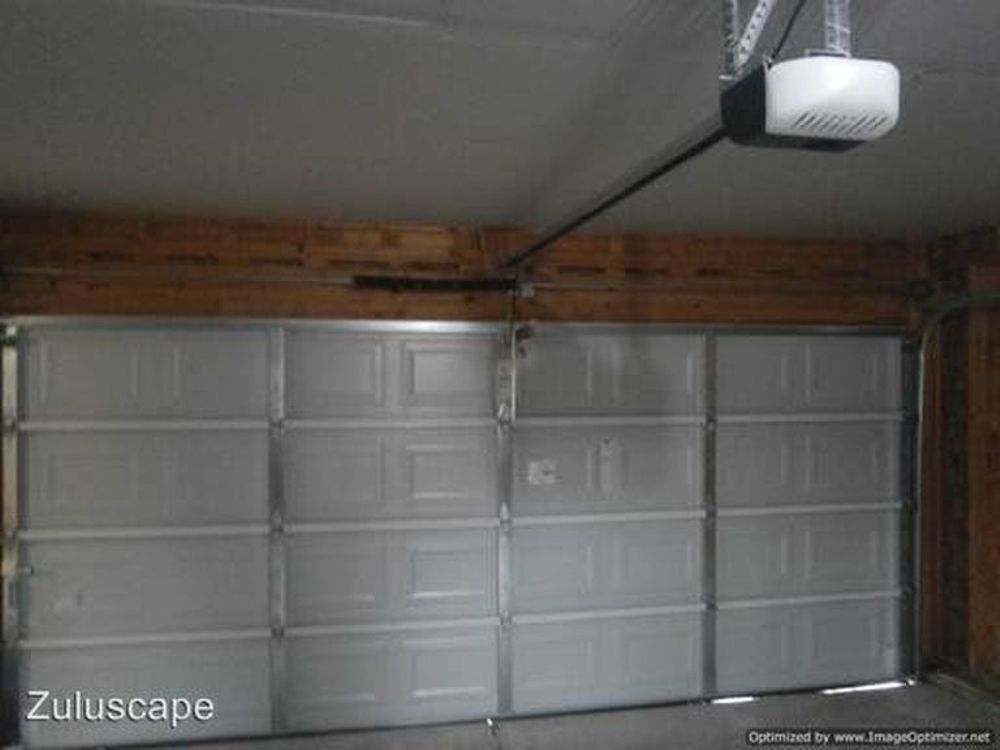
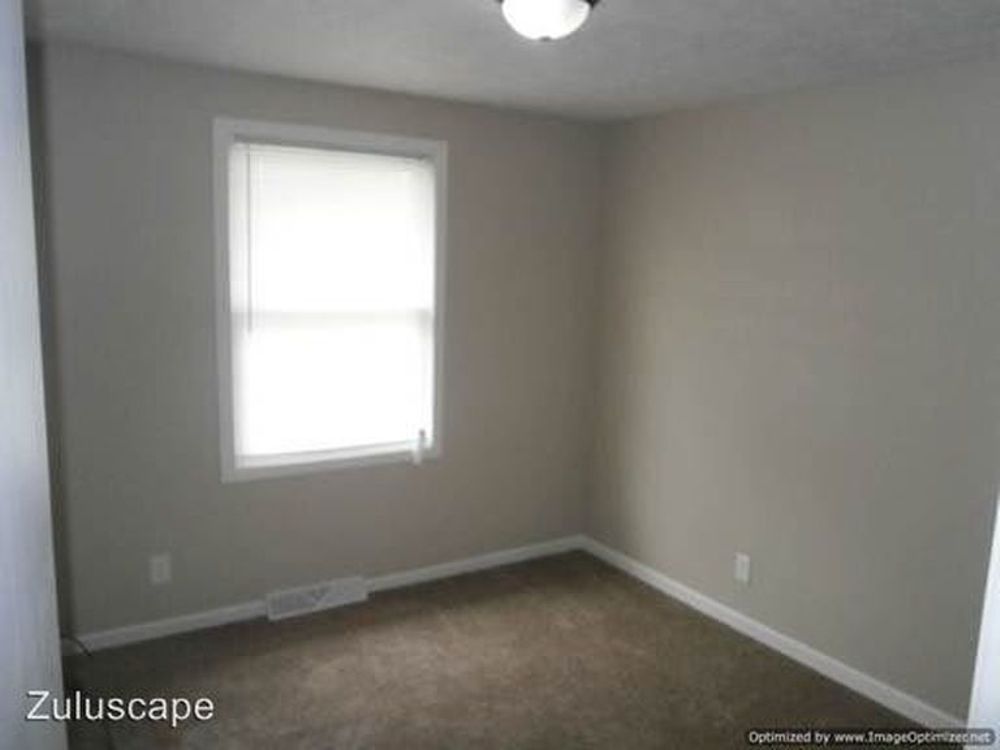
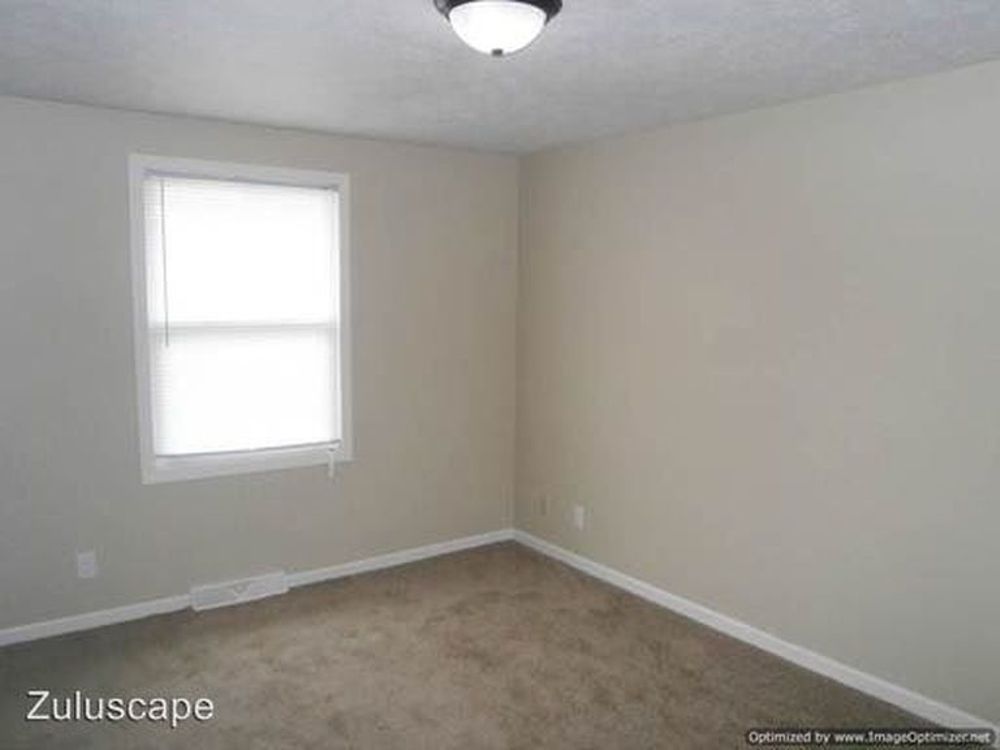
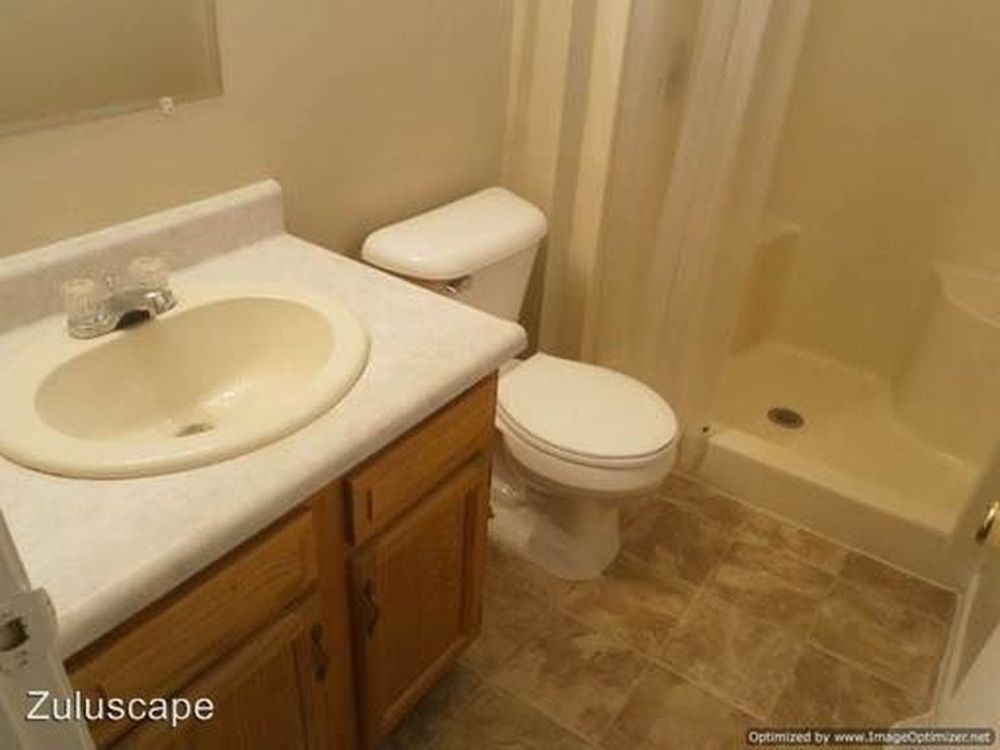
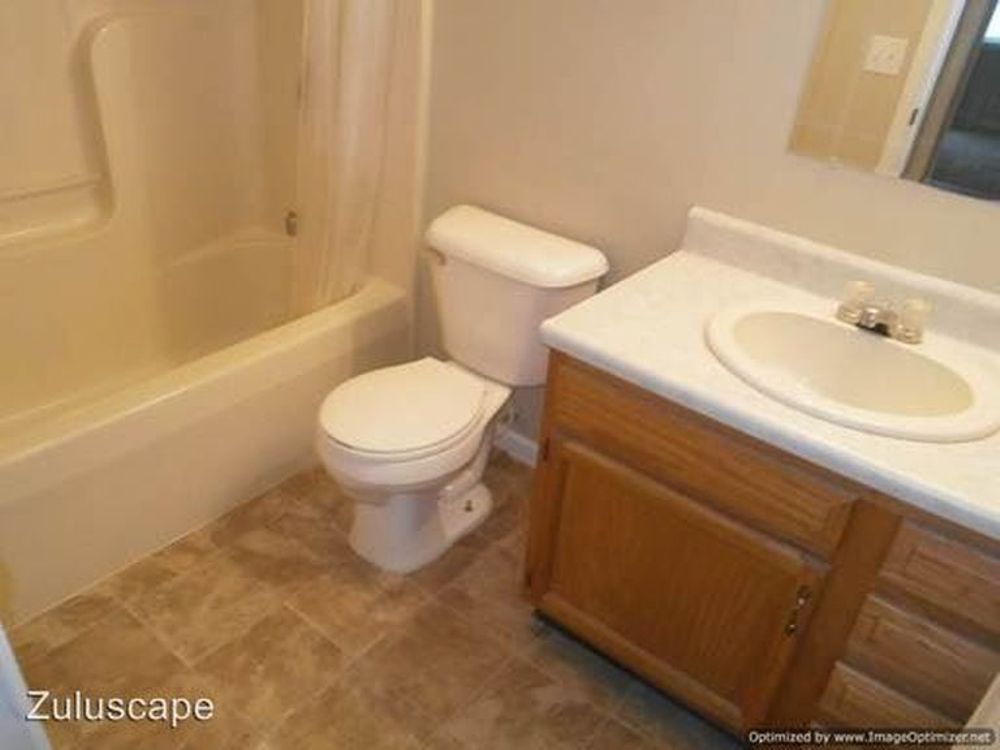
Photos
Sign in to edit this report, add or compare properties. Don't have an acount? Sign up now!