Property Report: RENTAL REPORT RENTAL
Property Report :
RENTAL REPORT
3841 Dunloe Ave, Cincinnati, OH 45213

Powered by
Real Estate Analysis
![]()
Created on: Apr 15, 2025
Author: Lisa WIlliams
Company: Keller Williams Seven Hills
Executive Summary
3841 Dunloe Ave, Cincinnati, OH 45213
Singlefamily: 3 bedrooms , 1 bathroom
Year built: 1910, Size: 1076 SF
Investment strategy: Rental Property

Financial Analysis
| Cash on Cash Return | 17.29 % |
| Internal Rate of Return (IRR) | 23.07 % |
| Capitalization Rate | 9.08 % |
| Gross Rent Multiplier (GRM) | 8.82 |
| Debt-coverage Ratio (DCR) | 1.67 |
| Operating Expense Ratio (OER) | 19.89 % |
Financial Breakdown
| Purchase Price | $ 162,000 |
| Purchase Costs | $ 1,600 |
| Repair/Construction Costs | $ 0 |
| $ 163,600 | |
| Financing | $ 129,600 |
| $ 34,000 | |
| $ 32,400 | |
| $ 1,600 |
Operating Analysis
| Rent | $ 1,530/mo |
| Gross Operating Income (GOI) | $ 18,360 |
| Total Expenses | $ 3,651 |
| Net Operating Income (NOI) | $ 14,709 |
| Annual Debt Service | $ 8,830 |
| Cash Flow Before Taxes (CFBT) | $ 5,879 |
| Income Tax Liability | $ 728 |
| Cash Flow After Taxes (CFAT) | $ 5,151 |
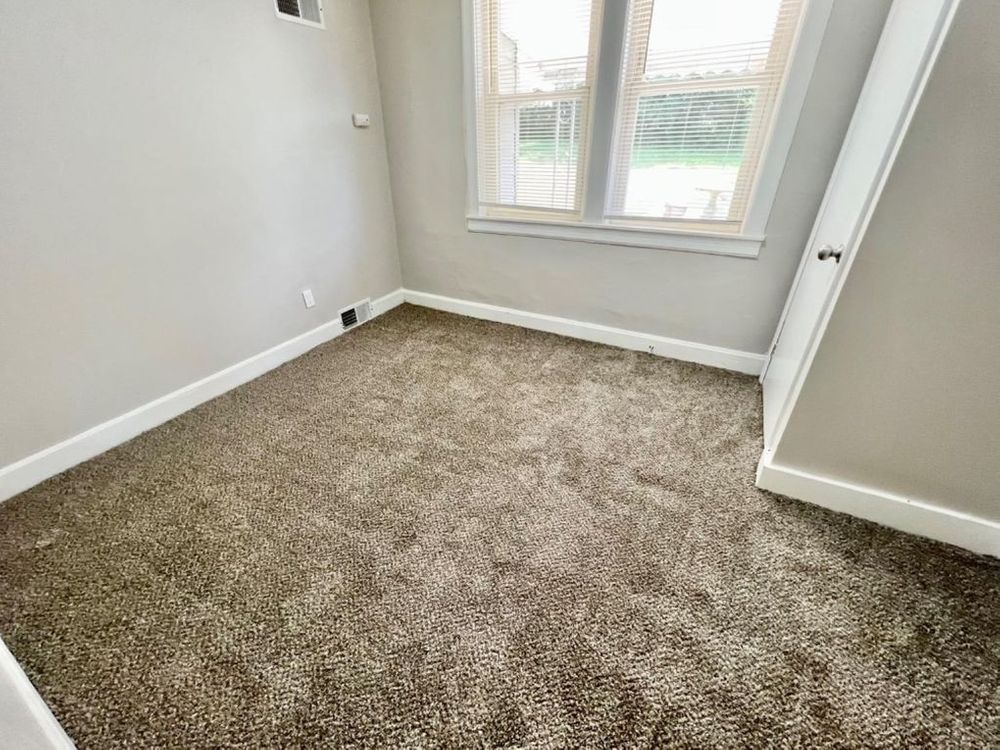
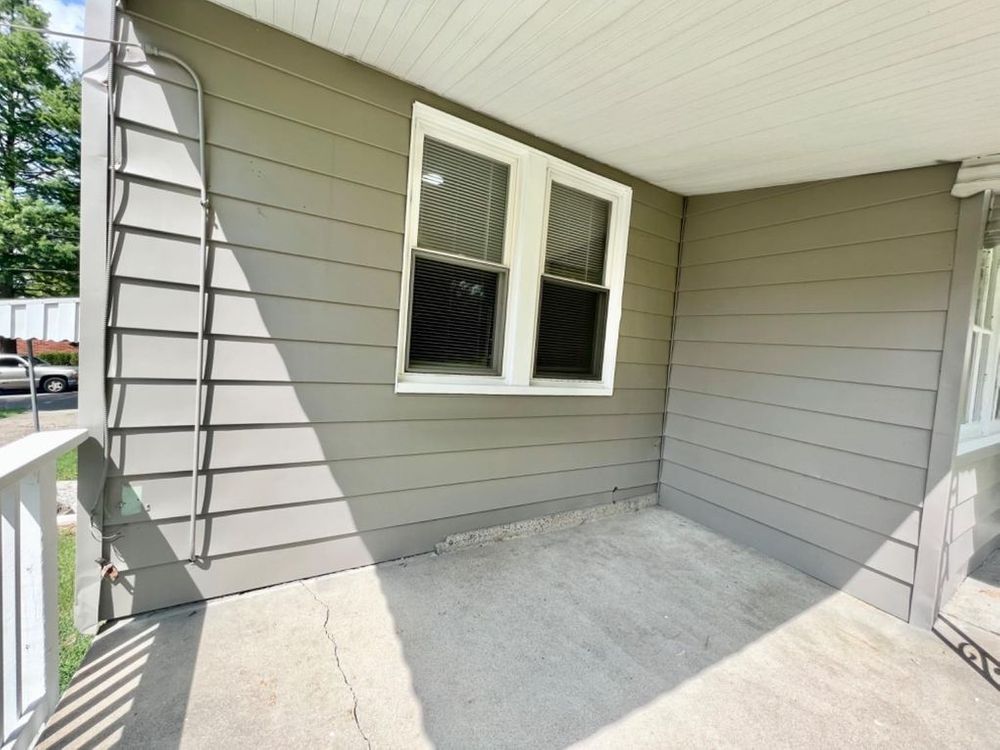
Property Description
Welcome Home!!! Newly Renovated, packed full of updates! Freshly painted+ new flooring throughout! All new kitchen featuring brand new white cabinet, ss appliances and granite counter tops! Fresh Bath! 3 bedrooms featuring brand new carpet and fixtures! Rest easy this home has new roof, new AC and serviced water heater(2019). This home also has had some electrical and plumbing updates. Check it out today before its gone!!!
| Purchase Price | $ 162,000 |
| Address | 3841 Dunloe Ave , Cincinnati, 45213, OH |
| MLS® # | 1749186 |
| Listing Agent | Kelley A Setterstrom |
| Listing Broker | RE/MAX Preferred Group |
| Year Built | 1910 |
| Type | Singlefamily |
| Size | 1076 SF |
| Bedrooms | 3 |
| Bathrooms | 1 |

Operating Analysis
Financial Analysis
Financing Overview
Long-term Cash Flow Forecast
Resale Analysis
Photos


Sign in to edit this report, add or compare properties. Don't have an acount? Sign up now!