Demo Realty LLC
123 Demo St
Demo, De 12345
Cal us today: 800-000-0000

Property Report: 3753 Grosvenor Rd, South Euclid RENTAL

Property Report :

3753 Grosvenor Rd, South Euclid, OH 44118

Created on: Apr 15, 2025

Author: Demo User

Company: Demo Realty LLC

3753 Grosvenor Rd, South Euclid, OH 44118

Singlefamily: 4 bedrooms , 1.5 bathrooms

Year built: 1928, Size: 1773 SF

Investment strategy: Rental Property

Purchase Price$ 89,900
Rent$ 1,600/mo
Monthly Cash Flow$ 1,131
Cash on Cash Return75.49 %

Financial Analysis

Cash on Cash Return 75.49 %
Internal Rate of Return (IRR) 45.65 %
Capitalization Rate 15.10 %
Gross Rent Multiplier (GRM) 4.68
Debt-coverage Ratio (DCR) 0.00
Operating Expense Ratio (OER) 21.45 %

Financial Breakdown

Purchase Price $ 89,900
Purchase Costs $ 0
Repair/Construction Costs $ 0
Total Capital Needed
$ 89,900
Financing $ 71,920
Total Cash Needed
$ 17,980
Cash at Closing
$ 17,980
Cash During Rehab
$ 0

Operating Analysis

Rent $ 1,600/mo
Gross Operating Income (GOI) $ 17,280
Total Expenses $ 3,706
Net Operating Income (NOI) $ 13,574
Annual Debt Service $ 0
Cash Flow Before Taxes (CFBT) $ 13,574
Income Tax Liability $ 5,480
Cash Flow After Taxes (CFAT) $ 8,095

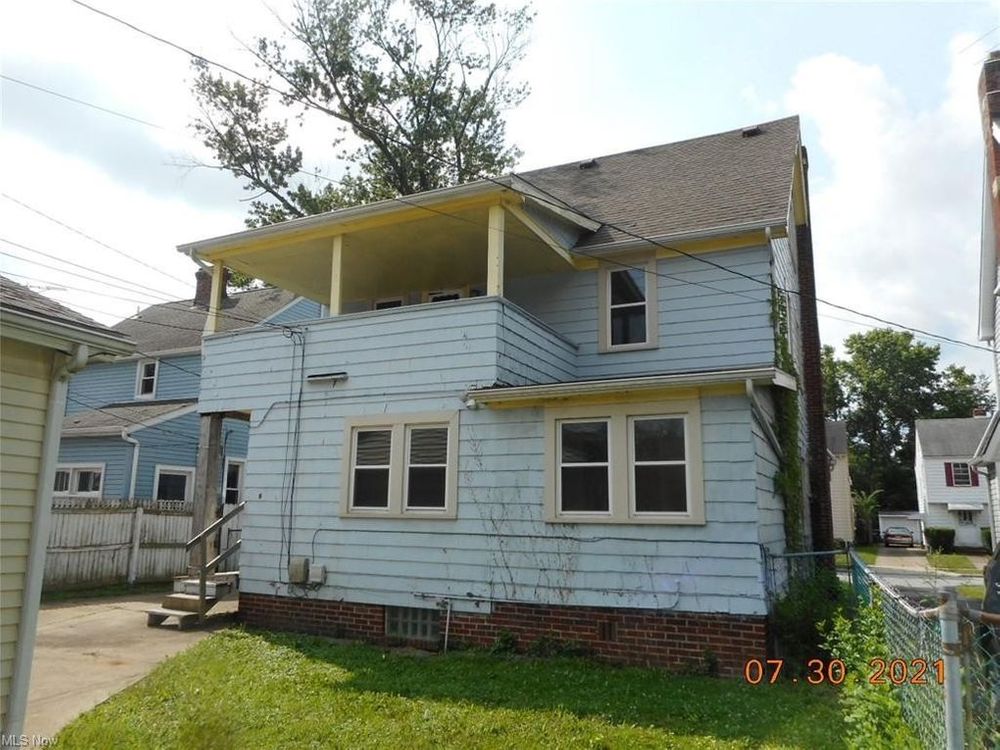
Investment Opportunity in this South Euclid Colonial with 4 bedrooms 1.5 bathrooms and 1, 773 square feet of living space. There is a large living room and dining room with a family room addition on the first floor. There is a large unfinished basement and a two car detached garage. This home has a newer roof and vinyl windows. This home does need repairs and buyer will be required to assume the South Euclid point of sale violations. The seller makes no representations or warranties about the condition of this home and it is to be sold in as is condition.

Purchase Price $ 89,900
Address 3753 Grosvenor Rd , South Euclid, 44118, OH
MLS® # 4305187
Listing Agent Gregory J Strnisa
Listing Broker Platinum Real Estate
Year Built 1928
Type Singlefamily
Size 1773 SF
Bedrooms 4
Bathrooms 1.5

Property History

Date Price Change Event
9/1/1975

Annual Property Operating Data

Incomes % of GOI
Gross Scheduled Income
$ 19,200    
Total Gross Income $ 19,200  
Vacancy loss
$ 1,920  
Gross Operating Income
$ 17,280 100.00 %
Expenses
Property manager $ 948 5.49 %
Property tax $ 2,494 14.43 %
Insurance $ 264 1.53 %
Total Expenses $ 3,706 21.45 %
Net Operating Income
$ 13,574 78.55 %
JavaScript chart by amCharts 3.20.13

Cash Flow (Year 1)

Net Operating Income $ 13,574 78.55 %
Annual Debt Service $ 0 0.00 %
Cash Flow Before Taxes (CFBT)
$ 13,574 78.55 %
Income Tax Liability $ 5,480 31.71 %
Cash Flow After Taxes (CFAT)
$ 8,095 46.84 %

Operating Ratios

Operating Expense Ratio
21.45 %
Break-Even Ratio
21.45 %

Financial Measures

Net Present Value
$ 124,591
Internal Rate of Return
45.65 %
Profitability Index
7.93
Annual Depreciation $ 2,615

Holding period of 30 years and discount rate of 5.00% were used for calculation of NPV and IRR. The rest of the financial measures are for the 1st year only and therefore don't provide such an exact information.

Investment Return Ratios

Cash on Cash Return
75.49 %
Return on Investment
80.49 %
Capitalization Rate
15.10 %
Gross Rental Yield
21.36 %
Gross Rent Multiplier
4.68
Financing
Down Payment $ 17,980
30y $ 71,920
Loan to Value Ratio
80.00 %
Loan to Cost Ratio
80.00 %
Debt Coverage Ratio 0.00
30y

Financing of: Purchase price ($ 89,900)

Type Amortized
Loan Amount $ 71,920
Down payment (20%) $ 17,980
Amortization 30 years
Interest Rate 0.00 %
Monthly Payment $ 0.00
JavaScript chart by amCharts 3.20.13

This chart shows the process of accumulation of investor's equity. There is some equity created right at the beginning with the rehab/construction and later investor's equity is rising by paying off the principal of the loan and also by appreciation over the years. All the green parts is the cummulative equity belonging to the investor and the red part belongs to the lender.

Year 0123456789101112131415161718192021222324252627282930
Operational Analysis
Gross Scheduled Income 0 19,200 19,392 19,586 19,782 19,980 20,179 20,381 20,585 20,791 20,999 21,209 21,421 21,635 21,851 22,070 22,291 22,514 22,739 22,966 23,196 23,428 23,662 23,899 24,138 24,379 24,623 24,869 25,118 25,369 25,623
Vacancy Loss 0 1,920 1,939 1,959 1,978 1,998 2,018 2,038 2,059 2,079 2,100 2,121 2,142 2,164 2,185 2,207 2,229 2,251 2,274 2,297 2,320 2,343 2,366 2,390 2,414 2,438 2,462 2,487 2,512 2,537 2,562
Gross Operating Income 0 17,280 17,453 17,627 17,804 17,982 18,161 18,343 18,527 18,712 18,899 19,088 19,279 19,472 19,666 19,863 20,062 20,262 20,465 20,669 20,876 21,085 21,296 21,509 21,724 21,941 22,160 22,382 22,606 22,832 23,060
Expenses 0 3,706 3,780 3,856 3,933 4,011 4,092 4,174 4,257 4,342 4,429 4,518 4,608 4,700 4,794 4,890 4,988 5,088 5,189 5,293 5,399 5,507 5,617 5,729 5,844 5,961 6,080 6,202 6,326 6,452 6,581
Net Operating Income 0 13,574 13,673 13,772 13,871 13,970 14,070 14,170 14,269 14,370 14,470 14,570 14,671 14,771 14,872 14,973 15,074 15,175 15,276 15,376 15,477 15,578 15,679 15,779 15,880 15,980 16,080 16,180 16,280 16,380 16,479
Loan Payment 0 0 0 0 0 0 0 0 0 0 0 0 0 0 0 0 0 0 0 0 0 0 0 0 0 0 0 0 0 0 0
Payment Interest Part 0 0 0 0 0 0 0 0 0 0 0 0 0 0 0 0 0 0 0 0 0 0 0 0 0 0 0 0 0 0 0
Payment Principal Part 0 0 0 0 0 0 0 0 0 0 0 0 0 0 0 0 0 0 0 0 0 0 0 0 0 0 0 0 0 0 71,920
Cash Flow
Repairs/Construction 0 0 0 0 0 0 0 0 0 0 0 0 0 0 0 0 0 0 0 0 0 0 0 0 0 0 0 0 0 0 0
Cash Flow Before Taxes -17,980 13,574 13,673 13,772 13,871 13,970 14,070 14,170 14,269 14,370 14,470 14,570 14,671 14,771 14,872 14,973 15,074 15,175 15,276 15,376 15,477 15,578 15,679 15,779 15,880 15,980 16,080 16,180 16,280 16,380 16,479
Depreciation 0 2,615 2,615 2,615 2,615 2,615 2,615 2,615 2,615 2,615 2,615 2,615 2,615 2,615 2,615 2,615 2,615 2,615 2,615 2,615 2,615 2,615 2,615 2,615 2,615 2,615 2,615 2,615 2,615 2,615 2,615
Taxes 0 5,480 5,529 5,578 5,628 5,678 5,727 5,777 5,827 5,877 5,927 5,978 6,028 6,078 6,129 6,179 6,229 6,280 6,330 6,381 6,431 6,481 6,532 6,582 6,632 6,683 6,733 6,783 6,833 6,882 6,932
Cash Flow After Taxes -17,980 8,095 8,144 8,193 8,243 8,293 8,342 8,392 8,442 8,492 8,542 8,593 8,643 8,693 8,744 8,794 8,844 8,895 8,945 8,996 9,046 9,096 9,147 9,197 9,247 9,298 9,348 9,398 9,448 9,497 9,547

Note: All amounts in the table above are in $

JavaScript chart by amCharts 3.20.13

Resale Price Evaluation Methods

The property is sold after 30 years. Below is the resale price calculated using different methods.

Appreciation (1.00%) $ 121,172
Cap Rate (15.10%) & NOI $ 109,132
Gross Rent Multiplier $ 119,913

Sale Proceeds

Projected Selling Price $ 121,172
Costs of Sale (6.00%) $ 7,270
1. Loan Balance Payoff $ 71,920
Net Sale Proceeds Before Tax $ 41,982

In the resale analysis we do not include any calculation for taxes that might be owed on sale of the property. The tax laws for the resale are rather complex and subjected to frequent changes.

Net Assets and Yield

Net Assets
Sale Proceeds Before Tax $ 41,982
Investor Cash Outlay $ 17,980
Net Assets $ 24,002
Average Yield
Annual Net Assets $ 800
Average Cash Flow (After Taxes) $ 8,502
Average Annual Gain (After Taxes) $ 9,302
Average Annual Yield (After Taxes) 10.35 %
JavaScript chart by amCharts 3.20.13

This charts shows Net Present Value (NPV) when property is sold in various years, i.e. when sold in 5th year, the NPV is calculated from 5 years of Cash Flow (including the selling price) and this NPV is displayed in year 5. Optimal holding period can be estimated, using this method - when NPV is the highest. Please note that appreciation growth can change these numbers greatly. It sometimes makes sense to sell the property even before the end of the mortgage term.

Sign in to edit this report, add or compare properties. Don't have an acount? Sign up now!

BESbswy