Big Bear Sheephorn LLC


Property Report: 36 Cinnamon Beach Way, Palm Coast RENTAL

Property Report :

36 Cinnamon Beach Way, Palm Coast, FL 32137

Created on: Apr 15, 2025

Author: John Duncan

Company: Big Bear Sheephorn LLC

36 Cinnamon Beach Way, Palm Coast, FL 32137

Singlefamily: 5 bedrooms , 4.5 bathrooms

Year built: 2018, Size: 3167 SF

Investment strategy: Rental Property

Purchase Price$ 1,299,000
Rent$ 15,000/mo
Monthly Cash Flow$ 4,527
Cash on Cash Return13.94 %

Financial Analysis

Cash on Cash Return 13.94 %
Internal Rate of Return (IRR) 17.79 %
Capitalization Rate 9.49 %
Gross Rent Multiplier (GRM) 7.22
Debt-coverage Ratio (DCR) 1.79
Operating Expense Ratio (OER) 31.50 %

Financial Breakdown

Purchase Price $ 1,299,000
Purchase Costs $ 0
Repair/Construction Costs $ 0
Total Capital Needed
$ 1,299,000
Financing $ 909,300
Total Cash Needed
$ 389,700
Cash at Closing
$ 389,700
Cash During Rehab
$ 0

Operating Analysis

Rent $ 15,000/mo
Gross Operating Income (GOI) $ 180,000
Total Expenses $ 56,708
Net Operating Income (NOI) $ 123,292
Annual Debt Service $ 68,969
Cash Flow Before Taxes (CFBT) $ 54,323
Income Tax Liability $ 6,674
Cash Flow After Taxes (CFAT) $ 47,649

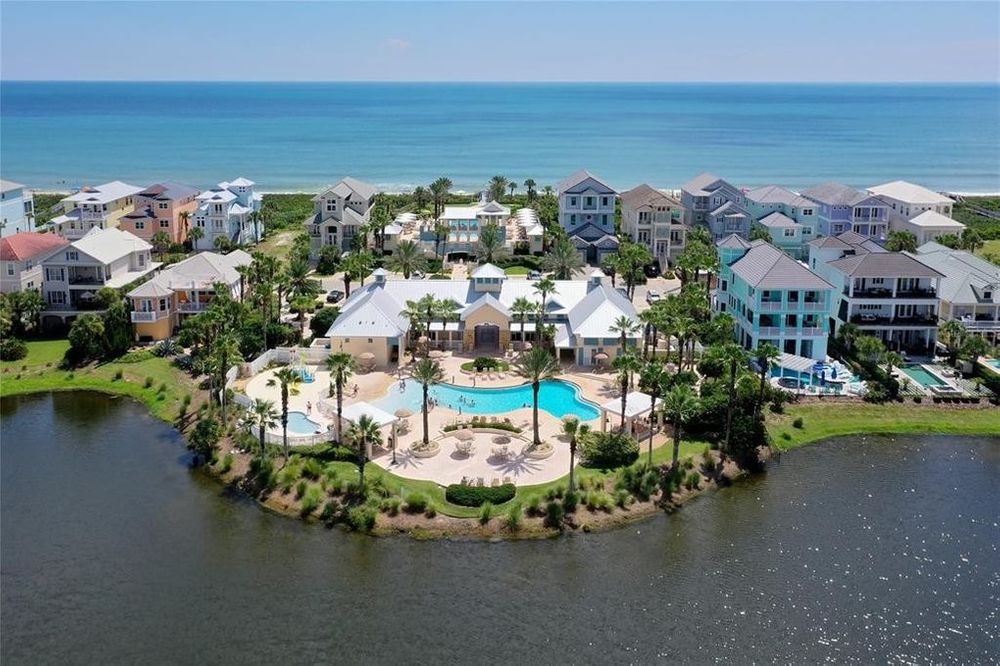
Cinnamon Beach is a one-of-a-kind community within the Hammock Beach luxury gated community, where unlimited short term rentals are allowed, the amenities are amazing, and the beach access is less than 5 minutes away!. 'Deja Blue House' was built in 2018. This two story lake view home was designed for first floor living and short term rental income. There are two Primary Bedrooms, one of each floor, with ensuite bathrooms, walk-in closets, separate tub and shower, dual sinks for each. Bedroom 3 also has an ensuite bath. Bedrooms 4 & 5 share a jack/jill bath. 4 of the 5 bedrooms have King Beds, Bedroom 5 had a twin and a trundle twin bed. There is a powder room on the main floor, easily accessed from the pool. Open concept Great Room/Kitchen/Dining area with a massive island that has seating for 4. Family room upstairs with covered balcony and open deck, perfect for lounging and afternoon cocktails! Laundry in first floor primary bedroom, and second Laundry Closet upstairs. Heated Salt Water Pool and Spa, Screen Enclosure, Outdoor Shower. The attention to detail and unique finishes will make you fall in love! Cinnamon Beach amenities are second to none, including an oceanfront pool complex with beach access, hot tub, and bar. The lakeside pool complex includes 2 pools, a restaurant, kids splash zone, hot tub, fitness center, lounge, kids arcade, onsite management office, business center, and more! Live here full-time, Live/rent part-time, or rent full-time--the choice is yours. Join the renowned Ocean Hammock Resort, enjoy St Augustine restaurants and nightlife-live the lifestyle you have always wanted! Quarterly HOA fees include Cinnamon Beach amenities and landscape maintenance.

Purchase Price $ 1,299,000
Address 36 Cinnamon Beach Way , Palm Coast, 32137, FL
MLS® # FC288122
Listing Agent Lauraine Holden
Listing Broker BERKSHIRE HATHAWAY HOMESERVICES PALM WEST REALTY
Year Built 2018
Type Singlefamily
Size 3167 SF
Bedrooms 5
Bathrooms 4.5

Property History

Date Price Change Event
8/27/2021
1/26/2017
8/25/2011
2/7/2006
8/25/2005
10/30/2002

Annual Property Operating Data

Incomes % of GOI
Gross Scheduled Income
$ 180,000    
Total Gross Income $ 180,000  
Vacancy loss
$ 0  
Gross Operating Income
$ 180,000 100.00 %
Expenses
Property manager $ 36,000 20.00 %
Association fees $ 5,124 2.85 %
Property tax $ 9,068 5.04 %
Insurance $ 6,516 3.62 %
Total Expenses $ 56,708 31.50 %
Net Operating Income
$ 123,292 68.50 %
JavaScript chart by amCharts 3.20.13

Cash Flow (Year 1)

Net Operating Income $ 123,292 68.50 %
Annual Debt Service $ 68,969 38.32 %
Cash Flow Before Taxes (CFBT)
$ 54,323 30.18 %
Income Tax Liability $ 6,674 3.71 %
Cash Flow After Taxes (CFAT)
$ 47,649 26.47 %

Operating Ratios

Operating Expense Ratio
31.50 %
Break-Even Ratio
69.82 %

Financial Measures

Net Present Value
$ 815,319
Internal Rate of Return
17.79 %
Profitability Index
3.09
Annual Depreciation $ 37,789

Holding period of 15 years and discount rate of 5.00% were used for calculation of NPV and IRR. The rest of the financial measures are for the 1st year only and therefore don't provide such an exact information.

Investment Return Ratios

Cash on Cash Return
13.94 %
Return on Investment
23.94 %
Capitalization Rate
9.49 %
Gross Rental Yield
13.86 %
Gross Rent Multiplier
7.22
Financing
Down Payment $ 389,700
Loan $ 909,300
Loan to Value Ratio
70.00 %
Loan to Cost Ratio
70.00 %
Debt Coverage Ratio 1.79
Loan

Financing of: Purchase price ($ 1,299,000)

Type Amortized
Loan Amount $ 909,300
Down payment (30%) $ 389,700
Amortization 30 years
Interest Rate 6.50 %
Monthly Payment $ 5,747.39
JavaScript chart by amCharts 3.20.13

This chart shows the process of accumulation of investor's equity. There is some equity created right at the beginning with the rehab/construction and later investor's equity is rising by paying off the principal of the loan and also by appreciation over the years. All the green parts is the cummulative equity belonging to the investor and the red part belongs to the lender.

Year 0123456789101112131415
Operational Analysis
Gross Scheduled Income 0 180,000 183,600 187,272 191,017 194,838 198,735 202,709 206,763 210,899 215,117 219,419 223,807 228,284 232,849 237,506
Vacancy Loss 0 0 0 0 0 0 0 0 0 0 0 0 0 0 0 0
Gross Operating Income 0 180,000 183,600 187,272 191,017 194,838 198,735 202,709 206,763 210,899 215,117 219,419 223,807 228,284 232,849 237,506
Expenses 0 56,708 57,842 58,999 60,179 61,383 62,610 63,862 65,140 66,442 67,771 69,127 70,509 71,919 73,358 74,825
Net Operating Income 0 123,292 125,758 128,273 130,838 133,455 136,124 138,847 141,624 144,456 147,345 150,292 153,298 156,364 159,491 162,681
Loan Payment 0 68,969 68,969 68,969 68,969 68,969 68,969 68,969 68,969 68,969 68,969 68,969 68,969 68,969 68,969 68,969
Payment Interest Part 0 58,805 58,125 57,398 56,623 55,797 54,915 53,973 52,969 51,897 50,754 49,534 48,233 46,844 45,362 43,781
Payment Principal Part 0 10,163 10,844 11,570 12,345 13,172 14,054 14,995 16,000 17,071 18,215 19,434 20,736 22,125 23,606 25,187
Cash Flow
Repairs/Construction 0 0 0 0 0 0 0 0 0 0 0 0 0 0 0 0
Cash Flow Before Taxes -389,700 54,323 56,789 59,304 61,870 64,487 67,156 69,878 72,655 75,488 78,377 81,324 84,329 87,395 90,523 93,712
Depreciation 0 37,789 37,789 37,789 37,789 37,789 37,789 37,789 37,789 37,789 37,789 37,789 37,789 37,789 37,789 37,789
Taxes 0 6,674 7,461 8,271 9,107 9,967 10,855 11,771 12,716 13,692 14,701 15,742 16,819 17,933 19,085 20,278
Cash Flow After Taxes -389,700 47,649 49,328 51,033 52,763 54,519 56,300 58,107 59,939 61,795 63,676 65,581 67,510 69,463 71,438 73,435

Note: All amounts in the table above are in $

JavaScript chart by amCharts 3.20.13

Resale Price Evaluation Methods

The property is sold after 15 years. Below is the resale price calculated using different methods.

Appreciation (3.00%) $ 2,023,800
Cap Rate (9.49%) & NOI $ 1,714,238
Gross Rent Multiplier $ 1,714,795

Sale Proceeds

Projected Selling Price $ 2,023,800
Costs of Sale (6.00%) $ 121,428
1. Loan Balance Payoff $ 659,780
Net Sale Proceeds Before Tax $ 1,242,592

In the resale analysis we do not include any calculation for taxes that might be owed on sale of the property. The tax laws for the resale are rather complex and subjected to frequent changes.

Net Assets and Yield

Net Assets
Sale Proceeds Before Tax $ 1,242,592
Investor Cash Outlay $ 389,700
Net Assets $ 852,892
Average Yield
Annual Net Assets $ 56,859
Average Cash Flow (After Taxes) $ 55,273
Average Annual Gain (After Taxes) $ 112,133
Average Annual Yield (After Taxes) 8.63 %
JavaScript chart by amCharts 3.20.13

This charts shows Net Present Value (NPV) when property is sold in various years, i.e. when sold in 5th year, the NPV is calculated from 5 years of Cash Flow (including the selling price) and this NPV is displayed in year 5. Optimal holding period can be estimated, using this method - when NPV is the highest. Please note that appreciation growth can change these numbers greatly. It sometimes makes sense to sell the property even before the end of the mortgage term.

Sign in to edit this report, add or compare properties. Don't have an acount? Sign up now!

BESbswy