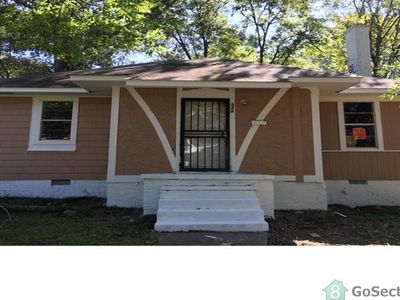
Property Report: Denver Street RENTAL

Property Report :

Denver Street

344 S Denver St, Jackson, MS 39209

Created on: Apr 15, 2025

Author: daniel kim

344 S Denver St, Jackson, MS 39209

Singlefamily: 2 bedrooms , 1 bathroom

Year built: 1940, Size: 958 SF

Investment strategy: Rental Property

Purchase Price$ 6,000
Rent$ 650/mo
Monthly Cash Flow$ 446
Cash on Cash Return21.64 %

Financial Analysis

Cash on Cash Return 21.64 %
Internal Rate of Return (IRR) 29.05 %
Capitalization Rate 13.38 %
Gross Rent Multiplier (GRM) 5.13
Debt-coverage Ratio (DCR) 0.00
Operating Expense Ratio (OER) 27.79 %
After Repair Value $ 40,000
Profit/Equity From Rehab $ 15,273

Financial Breakdown

Purchase Price $ 6,000
Purchase Costs $ 0
Repair/Construction Costs $ 18,727
Total Capital Needed
$ 24,727
Financing $ 0
Total Cash Needed
$ 24,727
Cash at Closing
$ 0
Cash During Rehab
$ 24,727

Operating Analysis

Rent $ 650/mo
Gross Operating Income (GOI) $ 7,410
Total Expenses $ 2,059
Net Operating Income (NOI) $ 5,351
Annual Debt Service $ 0
Cash Flow Before Taxes (CFBT) $ 5,351
Income Tax Liability $ 0
Cash Flow After Taxes (CFAT) $ 5,351

$650 - 2 Bed / 1 Bath home Fully renovated 2 bedrooms and 1 bath. This is a must-see for anyone looking for a home to raise a family. This home has a huge backyard and comes with a stove, refrigerator, and a 3-Ton Central Heating & Air system to cool the home during summer and keep the home warm in the winter. 1 mile to Jackson State University. Won't last long so apply now or give us a call at 601-813-4995 - we'll be happy to assist you! For more properties like this visit GoSection8.com.

Purchase Price $ 6,000
Address 344 S Denver St , Jackson, 39209, MS
Year Built 1940
Type Singlefamily
Size 958 SF
Bedrooms 2
Bathrooms 1
344 S Denver St Jackson, MS 39209
  • $ 40,000

    Property ARV
  • Singlefamily

    Bldg type
  • 958

    SqFt
  • $ 42

    per SqFt
  • 2

    Beds
  • 1

    Baths

It wasn't possible to load comps automatically for this address. You can add them manually below. Click here to see automatically selected comps on Redfin®

Filter properties
 
Property address Similarity Distance Beds Baths SqFt Bldg type Date sold Sale price $/SqFt Notes Edit
Average: $ 0 $ 0 /SqFt
Estimated ARV:
$ 0

Comps selected: 0

Annual Property Operating Data

Incomes % of GOI
Gross Scheduled Income
$ 7,800    
Total Gross Income $ 7,800  
Vacancy loss
$ 390  
Gross Operating Income
$ 7,410 100.00 %
Expenses
Property manager $ 741 10.00 %
Cap. Exp $ 371 5.00 %
Insurance $ 424 5.72 %
Maintenance $ 300 4.05 %
Property tax $ 224 3.03 %
Total Expenses $ 2,059 27.79 %
Net Operating Income
$ 5,351 72.21 %

Cash Flow (Year 1)

Net Operating Income $ 5,351 72.21 %
Annual Debt Service $ 0 0.00 %
Cash Flow Before Taxes (CFBT)
$ 5,351 72.21 %
Income Tax Liability $ 0 0.00 %
Cash Flow After Taxes (CFAT)
$ 5,351 72.21 %

Operating Ratios

Operating Expense Ratio
27.79 %
Break-Even Ratio
27.79 %

Financial Measures

Net Present Value
$ 13,602
Internal Rate of Return
29.05 %
Profitability Index
1.55
Annual Depreciation $ -39

Holding period of 5 years and discount rate of 15.00% were used for calculation of NPV and IRR. The rest of the financial measures are for the 1st year only and therefore don't provide such an exact information.

Investment Return Ratios

Cash on Cash Return
21.64 %
Return on Investment
21.88 %
Capitalization Rate
13.38 %
Gross Rental Yield
130.00 %
Gross Rent Multiplier
5.13

There is no financing selected in this deal.

This chart shows the process of accumulation of investor's equity. There is some equity created right at the beginning with the rehab/construction and later investor's equity is rising by paying off the principal of the loan and also by appreciation over the years. All the green parts is the cummulative equity belonging to the investor and the red part belongs to the lender.

Year
Operational Analysis
Gross Scheduled Income
Vacancy Loss
Gross Operating Income
Expenses
Net Operating Income
Cash Flow
Repairs/Construction
Cash Flow Before Taxes
Depreciation 0
Taxes
Cash Flow After Taxes

Note: All amounts in the table above are in $

Resale Price Evaluation Methods

The property is sold after 5 years. Below is the resale price calculated using different methods.

Capitalization (12.00%) & NOI $ 43,893
Appreciation (1.00%) $ 42,040
Gross Rent Multiplier $ 40,014

Sale Proceeds

Projected Selling Price $ 43,893
Costs of Sale (6.00%) $ 2,634
Net Sale Proceeds Before Tax $ 41,259

In the resale analysis we do not include any calculation for taxes that might be owed on sale of the property. The tax laws for the resale are rather complex and subjected to frequent changes.

Net Assets and Yield

Net Assets
Sale Proceeds Before Tax $ 41,259
Investor Cash Outlay $ 24,727
Net Assets $ 16,532
Average Yield
Annual Net Assets $ 3,306
Average Cash Flow (After Taxes) $ 0
Average Annual Gain (After Taxes) $ 0
Average Annual Yield (After Taxes) 0.00 %

This charts shows Net Present Value (NPV) when property is sold in various years, i.e. when sold in 5th year, the NPV is calculated from 5 years of Cash Flow (including the selling price) and this NPV is displayed in year 5. Optimal holding period can be estimated, using this method - when NPV is the highest. Please note that appreciation growth can change these numbers greatly. It sometimes makes sense to sell the property even before the end of the mortgage term.

Sign in to edit this report, add or compare properties. Don't have an acount? Sign up now!