{{ label }}

Real Estate Analysis


Property Report: RENTAL RENTAL
Property Report :
RENTAL
3439 Cornell Rd, Sharonville, OH 45241
Powered by
Real Estate Analysis
![]()
Created on: Apr 16, 2025
Author: Lisa WIlliams
Company: Keller Williams Seven Hills
Executive Summary
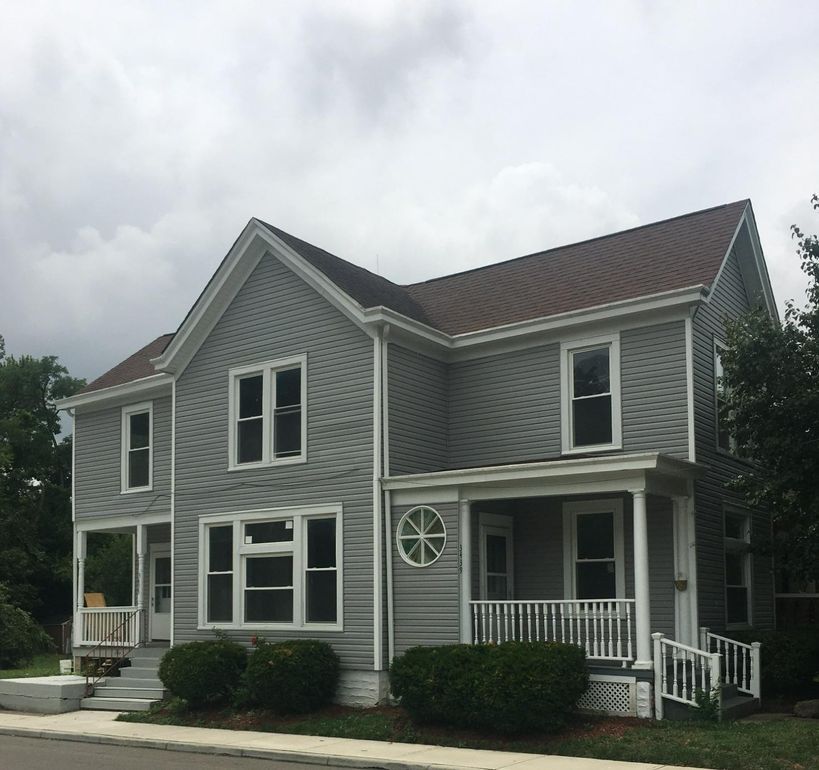
3439 Cornell Rd, Sharonville, OH 45241
Singlefamily: 3 bedrooms , 1 bathroom
Year built: 1911, Size: 1510 SF
Investment strategy: Rental Property
Purchase Price$ 225,000
Rent$ 1,575/mo
Monthly Cash Flow$ 27
Cash on Cash Return0.68 %
Financial Analysis
| Cash on Cash Return | 0.68 % |
| Internal Rate of Return (IRR) | 13.67 % |
| Capitalization Rate | 5.98 % |
| Gross Rent Multiplier (GRM) | 11.90 |
| Debt-coverage Ratio (DCR) | 1.02 |
| Operating Expense Ratio (OER) | 28.77 % |
Financial Breakdown
| Purchase Price | $ 225,000 |
| Purchase Costs | $ 2,200 |
| Repair/Construction Costs | $ 0 |
| $ 227,200 | |
| Financing | $ 180,000 |
| $ 47,200 | |
| $ 45,000 | |
| $ 2,200 |
Operating Analysis
| Rent | $ 1,575/mo |
| Gross Operating Income (GOI) | $ 18,900 |
| Total Expenses | $ 5,438 |
| Net Operating Income (NOI) | $ 13,462 |
| Annual Debt Service | $ 13,141 |
| Cash Flow Before Taxes (CFBT) | $ 321 |
| Income Tax Liability | $ -1,017 |
| Cash Flow After Taxes (CFAT) | $ 1,338 |
Property Description
Nice renovation. Hardwood floors throughout. New kitchen and bath. New stainless steel appliances and more. Large 3 car detached garage with new siding and new garage doors will be installed by sept.15.
| Purchase Price | $ 225,000 |
| Address | 3439 Cornell Rd , Sharonville, 45241, OH |
| MLS® # | 1746768 |
| Listing Agent | Timothy Shrout |
| Listing Broker | Keller Williams Distinctive Re |
| Year Built | 1911 |
| Type | Singlefamily |
| Size | 1510 SF |
| Bedrooms | 3 |
| Bathrooms | 1 |
Property History
| Date | Price | Change | Event |
|---|---|---|---|
| 7/12/2022 | |||
| 7/1/2022 |
Operating Analysis
Financial Analysis
Financing Overview
Long-term Cash Flow Forecast
Resale Analysis
Photos
Sign in to edit this report, add or compare properties. Don't have an acount? Sign up now!