{{ label }}

Real Estate Analysis


Property Report: DC Property RENTAL
Property Report :
DC Property
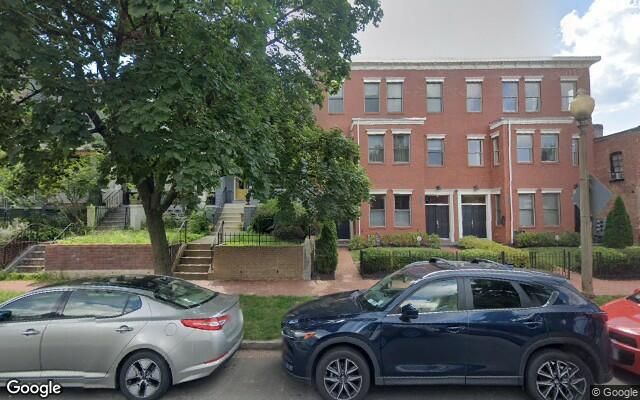
324 12th St NE #3 B, Washington, DC 20002
Powered by
Real Estate Analysis
Created on: Jul 29, 2025
Author: Paiyal Patel
Executive Summary
324 12th St NE #3 B, Washington, DC 20002
Condominium: 5 rooms: 3 bedrooms , 2.5 bathrooms
Year built: 2011, Size: 1796 SF
Investment strategy: Rental Property
Purchase Price$ 714,000
Rent$ 3,000/mo
Monthly Cash Flow$ 865
Cash on Cash Return1.45 %
Financial Analysis
| Cash on Cash Return | 1.45 % |
| Internal Rate of Return (IRR) | 4.56 % |
| Capitalization Rate | 1.45 % |
| Gross Rent Multiplier (GRM) | 19.83 |
| Debt-coverage Ratio (DCR) | 0.00 |
| Operating Expense Ratio (OER) | 68.98 % |
Financial Breakdown
| Purchase Price | $ 714,000 |
| Purchase Costs | $ 0 |
| Repair/Construction Costs | $ 0 |
| $ 714,000 | |
| Financing | $ 0 |
| $ 714,000 | |
| $ 0 | |
| $ 714,000 |
Operating Analysis
| Rent | $ 3,000/mo |
| Gross Operating Income (GOI) | $ 33,480 |
| Total Expenses | $ 23,096 |
| Net Operating Income (NOI) | $ 10,384 |
| Annual Debt Service | $ 0 |
| Cash Flow Before Taxes (CFBT) | $ 10,384 |
| Income Tax Liability | $ -2,597 |
| Cash Flow After Taxes (CFAT) | $ 12,981 |
Property Description
| Purchase Price | $ 714,000 |
| Address | 324 12th St NE #3 B, Washington, 20002, DC |
| Year Built | 2011 |
| Type | Condominium |
| Size | 1796 SF |
| Bedrooms | 3 |
| Bathrooms | 2.5 |
| Rooms Total | 5 |
Operating Analysis
Long-term Cash Flow Forecast
Sign in to edit this report, add or compare properties. Don't have an acount? Sign up now!