Chase Real Estate - ChaseForeclosure.com
1903 Springbrook Square Dr
Naperville, IL 60564
www.ChaseRental.com

Property Report: 317 Jessie St, Joliet RENTAL

Property Report :

317 Jessie St, Joliet, IL 60433

Created on: Apr 15, 2025

Author: Christian Chase

Company: Chase Real Estate - ChaseForeclosure.com

317 Jessie St, Joliet, IL 60433

Singlefamily: 3 bedrooms , 1 bathroom

Year built: 1931, Size: 1215 SF

Investment strategy: Rental Property

Purchase Price$ 209,900
Rent$ 2,145/mo
Monthly Cash Flow$ 206
Cash on Cash Return4.83 %

Financial Analysis

Cash on Cash Return 4.83 %
Internal Rate of Return (IRR) 11.92 %
Capitalization Rate 8.21 %
Gross Rent Multiplier (GRM) 8.15
Debt-coverage Ratio (DCR) 1.17
Operating Expense Ratio (OER) 30.95 %
After Repair Value $ 209,900

Financial Breakdown

Purchase Price $ 209,900
Purchase Costs $ 9,108
Repair/Construction Costs $ 0
Total Capital Needed
$ 219,008
Financing $ 167,920
Total Cash Needed
$ 51,088
Cash at Closing
$ 45,338
Cash During Rehab
$ 5,750

Operating Analysis

Rent $ 2,145/mo
Gross Operating Income (GOI) $ 24,968
Total Expenses $ 7,728
Net Operating Income (NOI) $ 17,240
Annual Debt Service $ 14,772
Cash Flow Before Taxes (CFBT) $ 2,468
Income Tax Liability $ -558
Cash Flow After Taxes (CFAT) $ 3,026

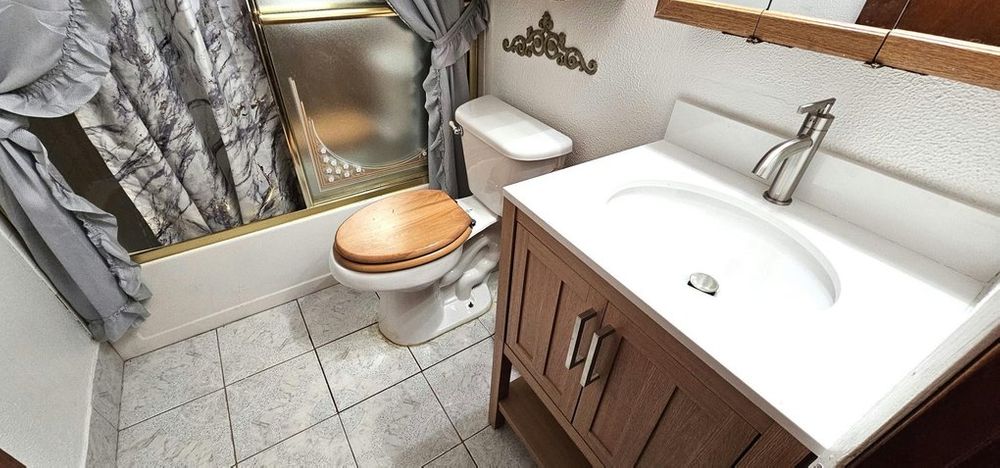
Welcome to this charming, recently updated home, perfect for comfortable family living! Featuring A Home Warranty, Newer Goodman furnace, New Roof On Home and Garage 2024, 3 spacious bedrooms and 1 full bath with a brand-new vanity and sink, this home has a mix of beautiful hardwood floors and new carpet throughout. The huge master bedroom boasts new carpet and plenty of space for relaxing. Set on a generous double lot, the property includes both a large family room and living room, offering versatile living spaces. The spacious kitchen is designed with a large eating area, ideal for gatherings and casual dining. Outdoor living is enhanced with a 26x8 concrete patio and an 18x14 brick paver patio with a lovely Pergola, perfect for entertaining. Ceiling fans add comfort throughout the home, while the oversized 2.5-car garage provides abundant storage and parking space. Freshly painted, this home is move-in ready and waiting for you!

Purchase Price $ 209,900
Address 317 Jessie St , Joliet, 60433, IL
MLS® # 12213536
Listing Agent Steve W Sweedler
Year Built 1931
Type Singlefamily
Size 1215 SF
Bedrooms 3
Bathrooms 1

Property History

Date Price Change Event
12/4/2024 209900 Price Changed
11/28/2024 214900 Price Changed
11/19/2024 Listing removed
11/18/2024 217900 Listed
11/6/2024 219900 Price Changed
11/1/2024 224500 Listed
9/15/1999 82000 Sold

Annual Property Operating Data

Incomes % of GOI
Gross Scheduled Income
$ 25,740    
Total Gross Income $ 25,740  
Vacancy loss
$ 772  
Gross Operating Income
$ 24,968 100.00 %
Expenses
Insurance $ 1,500 6.01 %
Property tax $ 6,228 24.94 %
Total Expenses $ 7,728 30.95 %
Net Operating Income
$ 17,240 69.05 %
JavaScript chart by amCharts 3.20.13

Cash Flow (Year 1)

Net Operating Income $ 17,240 69.05 %
Annual Debt Service $ 14,772 59.16 %
Cash Flow Before Taxes (CFBT)
$ 2,468 9.89 %
Income Tax Liability $ -558 -2.24 %
Cash Flow After Taxes (CFAT)
$ 3,026 12.12 %

Operating Ratios

Operating Expense Ratio
30.95 %
Break-Even Ratio
90.11 %

Financial Measures

Net Present Value
$ 119,426
Internal Rate of Return
11.92 %
Profitability Index
3.34
Annual Depreciation $ 6,106

Holding period of 30 years and discount rate of 5.00% were used for calculation of NPV and IRR. The rest of the financial measures are for the 1st year only and therefore don't provide such an exact information.

Investment Return Ratios

Cash on Cash Return
4.83 %
Return on Investment
17.16 %
Capitalization Rate
8.21 %
Gross Rental Yield
12.26 %
Gross Rent Multiplier
8.15
Financing % of ARV
Down Payment $ 41,980 20.00 %
HomeStyle $ 167,920 80.00 %
Loan to Value Ratio
80.00 %
Loan to Cost Ratio
80.00 %
Debt Coverage Ratio 1.17
HomeStyle

Financing of: Purchase + Repairs ($ 209,900)

Type Amortized
Loan Amount $ 167,920
Down payment (20%) $ 41,980
Amortization 30 years
Interest Rate 7.99 %
Monthly Payment $ 1,230.97
JavaScript chart by amCharts 3.20.13

This chart shows the process of accumulation of investor's equity. There is some equity created right at the beginning with the rehab/construction and later investor's equity is rising by paying off the principal of the loan and also by appreciation over the years. All the green parts is the cummulative equity belonging to the investor and the red part belongs to the lender.

Year 0123456789101112131415161718192021222324252627282930
Operational Analysis
Gross Scheduled Income 0 25,740 26,255 26,780 27,316 27,862 28,419 28,987 29,567 30,159 30,762 31,377 32,004 32,645 33,297 33,963 34,643 35,336 36,042 36,763 37,498 38,248 39,013 39,794 40,589 41,401 42,229 43,074 43,935 44,814 45,710
Vacancy Loss 0 772 788 803 819 836 853 870 887 905 923 941 960 979 999 1,019 1,039 1,060 1,081 1,103 1,125 1,147 1,170 1,194 1,218 1,242 1,267 1,292 1,318 1,344 1,371
Gross Operating Income 0 24,968 25,467 25,977 26,496 27,026 27,566 28,118 28,680 29,254 29,839 30,436 31,044 31,665 32,299 32,944 33,603 34,275 34,961 35,660 36,373 37,101 37,843 38,600 39,372 40,159 40,962 41,782 42,617 43,470 44,339
Expenses 0 7,728 7,883 8,040 8,201 8,365 8,532 8,703 8,877 9,055 9,236 9,420 9,609 9,801 9,997 10,197 10,401 10,609 10,821 11,037 11,258 11,483 11,713 11,947 12,186 12,430 12,679 12,932 13,191 13,455 13,724
Net Operating Income 0 17,240 17,585 17,936 18,295 18,661 19,034 19,415 19,803 20,199 20,603 21,015 21,436 21,864 22,302 22,748 23,203 23,667 24,140 24,623 25,115 25,617 26,130 26,652 27,185 27,729 28,284 28,849 29,426 30,015 30,615
Loan Payment 0 14,772 14,772 14,772 14,772 14,772 14,772 14,772 14,772 14,772 14,772 14,772 14,772 14,772 14,772 14,772 14,772 14,772 14,772 14,772 14,772 14,772 14,772 14,772 14,772 14,772 14,772 14,772 14,772 14,772 14,772
Payment Interest Part 0 13,366 13,250 13,123 12,987 12,839 12,679 12,505 12,317 12,114 11,894 11,655 11,397 11,117 10,814 10,486 10,131 9,746 9,329 8,878 8,390 7,861 7,288 6,667 5,996 5,268 4,480 3,627 2,704 1,703 620
Payment Principal Part 0 1,406 1,522 1,648 1,785 1,933 2,093 2,266 2,454 2,658 2,878 3,117 3,375 3,655 3,958 4,286 4,641 5,026 5,442 5,893 6,382 6,911 7,484 8,104 8,776 9,503 10,291 11,144 12,068 13,068 14,152
Cash Flow
Repairs/Construction 0 0 0 0 0 0 0 0 0 0 0 0 0 0 0 0 0 0 0 0 0 0 0 0 0 0 0 0 0 0 0
Cash Flow Before Taxes -51,088 2,468 2,813 3,165 3,523 3,889 4,263 4,643 5,032 5,428 5,832 6,244 6,664 7,093 7,530 7,976 8,431 8,895 9,368 9,851 10,344 10,846 11,358 11,881 12,414 12,958 13,512 14,078 14,655 15,243 15,844
Depreciation 0 6,106 6,106 6,106 6,106 6,106 6,106 6,106 6,106 6,106 6,106 6,106 6,106 6,106 6,106 6,106 6,106 6,106 6,106 6,106 6,106 6,106 6,106 6,106 6,106 6,106 6,106 6,106 6,106 6,106 6,106
Taxes 0 -558 -443 -323 -199 -71 62 201 345 495 651 814 983 1,160 1,345 1,539 1,741 1,954 2,176 2,410 2,655 2,913 3,184 3,470 3,771 4,089 4,424 4,779 5,154 5,551 5,972
Cash Flow After Taxes -51,088 3,026 3,256 3,488 3,723 3,960 4,200 4,442 4,687 4,933 5,181 5,430 5,681 5,932 6,185 6,437 6,689 6,941 7,192 7,441 7,689 7,933 8,174 8,411 8,643 8,869 9,088 9,299 9,501 9,692 9,871

Note: All amounts in the table above are in $

JavaScript chart by amCharts 3.20.13

Resale Price Evaluation Methods

The property is sold after 30 years. Below is the resale price calculated using different methods.

Capitalization (8.21%) & NOI $ 372,901
Appreciation (3.00%) $ 509,482
Gross Rent Multiplier $ 372,539

Sale Proceeds

Projected Selling Price $ 372,901
Costs of Sale (3.50%) $ 13,052
Net Sale Proceeds Before Tax $ 359,849

In the resale analysis we do not include any calculation for taxes that might be owed on sale of the property. The tax laws for the resale are rather complex and subjected to frequent changes.

Net Assets and Yield

Net Assets
Sale Proceeds Before Tax $ 359,849
Investor Cash Outlay $ 51,088
Net Assets $ 308,761
Average Yield
Annual Net Assets $ 10,292
Average Cash Flow (After Taxes) $ 6,204
Average Annual Gain (After Taxes) $ 16,496
Average Annual Yield (After Taxes) 7.86 %
JavaScript chart by amCharts 3.20.13

This charts shows Net Present Value (NPV) when property is sold in various years, i.e. when sold in 5th year, the NPV is calculated from 5 years of Cash Flow (including the selling price) and this NPV is displayed in year 5. Optimal holding period can be estimated, using this method - when NPV is the highest. Please note that appreciation growth can change these numbers greatly. It sometimes makes sense to sell the property even before the end of the mortgage term.

Sign in to edit this report, add or compare properties. Don't have an acount? Sign up now!

BESbswy