Chase Real Estate - ChaseForeclosure.com
1903 Springbrook Square Dr
Naperville, IL 60564
www.ChaseRental.com

Property Report: 30 Indianwood Dr, Thornton RENTAL

Property Report :

30 Indianwood Dr, Thornton, IL 60476

Created on: Apr 16, 2025

Author: Christian Chase

Company: Chase Real Estate - ChaseForeclosure.com

30 Indianwood Dr, Thornton, IL 60476

Singlefamily: 3 bedrooms , 2 bathrooms

Year built: 1959, Size: 1040 SF

Investment strategy: Rental Property

Purchase Price$ 175,000
Rent$ 2,400/mo
Monthly Cash Flow$ 606
Cash on Cash Return16.70 %

Financial Analysis

Cash on Cash Return 16.70 %
Internal Rate of Return (IRR) 18.80 %
Capitalization Rate 11.19 %
Gross Rent Multiplier (GRM) 6.08
Debt-coverage Ratio (DCR) 1.59
Operating Expense Ratio (OER) 29.88 %
After Repair Value $ 175,000

Financial Breakdown

Purchase Price $ 175,000
Purchase Costs $ 8,550
Repair/Construction Costs $ 0
Total Capital Needed
$ 183,550
Financing $ 140,000
Total Cash Needed
$ 43,550
Cash at Closing
$ 37,800
Cash During Rehab
$ 5,750

Operating Analysis

Rent $ 2,400/mo
Gross Operating Income (GOI) $ 27,936
Total Expenses $ 8,347
Net Operating Income (NOI) $ 19,589
Annual Debt Service $ 12,316
Cash Flow Before Taxes (CFBT) $ 7,273
Income Tax Liability $ 839
Cash Flow After Taxes (CFAT) $ 6,435

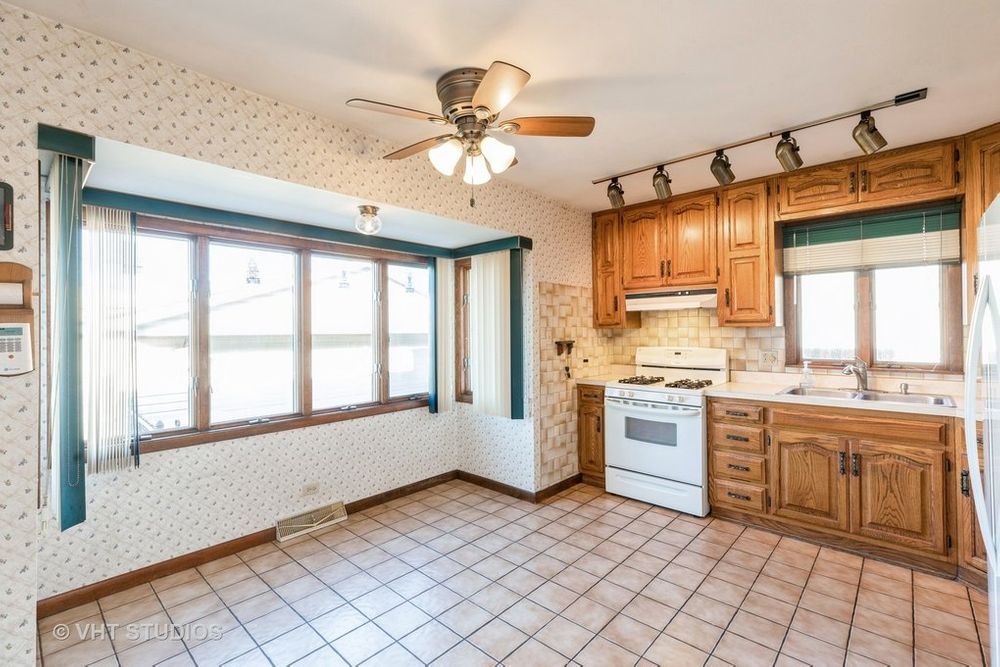
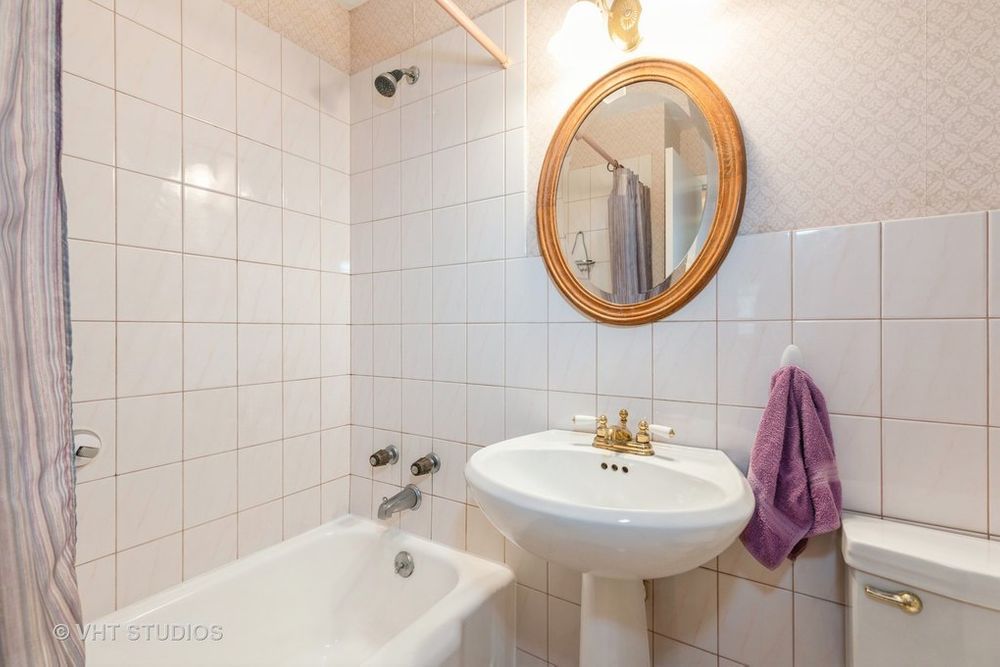
This Well-Maintained 3-Bedroom, 1.5 Bath Ranch with a Finished Basement is Ready for You to Move-in Today. The Kitchen Features a Bump-Out, which creates a True Eat-In Kitchen. There are Hardwood Floors Under All the Carpeting. The Home's Electric Service was Replaced Two Years Ago. The Garage's Siding and Roof were Replaced 6 Years ago.

Purchase Price $ 175,000
Address 30 Indianwood Dr , Thornton, 60476, IL
MLS® # 12204502
Listing Agent Nicholas Radakovich
Year Built 1959
Type Singlefamily
Size 1040 SF
Bedrooms 3
Bathrooms 2

Property History

Date Price Change Event
12/3/2024 175000 Price Changed
11/7/2024 185000 Listed

Annual Property Operating Data

Incomes % of GOI
Gross Scheduled Income
$ 28,800    
Total Gross Income $ 28,800  
Vacancy loss
$ 864  
Gross Operating Income
$ 27,936 100.00 %
Expenses
Insurance $ 1,500 5.37 %
Property tax $ 6,847 24.51 %
Total Expenses $ 8,347 29.88 %
Net Operating Income
$ 19,589 70.12 %
JavaScript chart by amCharts 3.20.13

Cash Flow (Year 1)

Net Operating Income $ 19,589 70.12 %
Annual Debt Service $ 12,316 44.08 %
Cash Flow Before Taxes (CFBT)
$ 7,273 26.04 %
Income Tax Liability $ 839 3.00 %
Cash Flow After Taxes (CFAT)
$ 6,435 23.03 %

Operating Ratios

Operating Expense Ratio
29.88 %
Break-Even Ratio
73.96 %

Financial Measures

Net Present Value
$ 174,352
Internal Rate of Return
18.80 %
Profitability Index
5.00
Annual Depreciation $ 5,091

Holding period of 30 years and discount rate of 5.00% were used for calculation of NPV and IRR. The rest of the financial measures are for the 1st year only and therefore don't provide such an exact information.

Investment Return Ratios

Cash on Cash Return
16.70 %
Return on Investment
28.76 %
Capitalization Rate
11.19 %
Gross Rental Yield
16.46 %
Gross Rent Multiplier
6.08
Financing % of ARV
Down Payment $ 35,000 20.00 %
HomeStyle $ 140,000 80.00 %
Loan to Value Ratio
80.00 %
Loan to Cost Ratio
80.00 %
Debt Coverage Ratio 1.59
HomeStyle

Financing of: Purchase + Repairs ($ 175,000)

Type Amortized
Loan Amount $ 140,000
Down payment (20%) $ 35,000
Amortization 30 years
Interest Rate 7.99 %
Monthly Payment $ 1,026.29
JavaScript chart by amCharts 3.20.13

This chart shows the process of accumulation of investor's equity. There is some equity created right at the beginning with the rehab/construction and later investor's equity is rising by paying off the principal of the loan and also by appreciation over the years. All the green parts is the cummulative equity belonging to the investor and the red part belongs to the lender.

Year 0123456789101112131415161718192021222324252627282930
Operational Analysis
Gross Scheduled Income 0 28,800 29,376 29,964 30,563 31,174 31,798 32,433 33,082 33,744 34,419 35,107 35,809 36,525 37,256 38,001 38,761 39,536 40,327 41,133 41,956 42,795 43,651 44,524 45,415 46,323 47,249 48,194 49,158 50,141 51,144
Vacancy Loss 0 864 881 899 917 935 954 973 992 1,012 1,033 1,053 1,074 1,096 1,118 1,140 1,163 1,186 1,210 1,234 1,259 1,284 1,310 1,336 1,362 1,390 1,417 1,446 1,475 1,504 1,534
Gross Operating Income 0 27,936 28,495 29,065 29,646 30,239 30,844 31,460 32,090 32,731 33,386 34,054 34,735 35,430 36,138 36,861 37,598 38,350 39,117 39,899 40,697 41,511 42,342 43,188 44,052 44,933 45,832 46,749 47,684 48,637 49,610
Expenses 0 8,347 8,514 8,684 8,858 9,035 9,216 9,400 9,588 9,780 9,975 10,175 10,378 10,586 10,798 11,014 11,234 11,459 11,688 11,922 12,160 12,403 12,651 12,904 13,162 13,426 13,694 13,968 14,247 14,532 14,823
Net Operating Income 0 19,589 19,981 20,380 20,788 21,204 21,628 22,060 22,502 22,952 23,411 23,879 24,356 24,844 25,340 25,847 26,364 26,891 27,429 27,978 28,537 29,108 29,690 30,284 30,890 31,508 32,138 32,781 33,436 34,105 34,787
Loan Payment 0 12,316 12,316 12,316 12,316 12,316 12,316 12,316 12,316 12,316 12,316 12,316 12,316 12,316 12,316 12,316 12,316 12,316 12,316 12,316 12,316 12,316 12,316 12,316 12,316 12,316 12,316 12,316 12,316 12,316 12,316
Payment Interest Part 0 11,144 11,047 10,941 10,827 10,704 10,571 10,426 10,269 10,100 9,916 9,717 9,502 9,268 9,016 8,742 8,446 8,125 7,778 7,402 6,995 6,554 6,076 5,559 4,999 4,392 3,735 3,024 2,254 1,420 517
Payment Principal Part 0 1,172 1,269 1,374 1,488 1,611 1,745 1,890 2,046 2,216 2,400 2,598 2,814 3,047 3,300 3,573 3,869 4,190 4,537 4,914 5,321 5,762 6,240 6,757 7,317 7,923 8,580 9,291 10,062 10,896 11,799
Cash Flow
Repairs/Construction 0 0 0 0 0 0 0 0 0 0 0 0 0 0 0 0 0 0 0 0 0 0 0 0 0 0 0 0 0 0 0
Cash Flow Before Taxes -43,550 7,273 7,665 8,065 8,472 8,888 9,312 9,745 10,186 10,636 11,095 11,563 12,041 12,528 13,025 13,532 14,049 14,576 15,114 15,662 16,222 16,793 17,375 17,969 18,574 19,192 19,822 20,465 21,121 21,789 22,471
Depreciation 0 5,091 5,091 5,091 5,091 5,091 5,091 5,091 5,091 5,091 5,091 5,091 5,091 5,091 5,091 5,091 5,091 5,091 5,091 5,091 5,091 5,091 5,091 5,091 5,091 5,091 5,091 5,091 5,091 5,091 5,091
Taxes 0 839 961 1,087 1,217 1,352 1,492 1,636 1,785 1,940 2,101 2,268 2,441 2,621 2,808 3,003 3,207 3,419 3,640 3,871 4,113 4,366 4,631 4,909 5,200 5,506 5,828 6,166 6,523 6,898 7,295
Cash Flow After Taxes -43,550 6,435 6,704 6,978 7,255 7,536 7,821 8,109 8,401 8,696 8,994 9,296 9,600 9,907 10,217 10,528 10,842 11,157 11,474 11,791 12,109 12,427 12,744 13,060 13,374 13,686 13,994 14,299 14,598 14,891 15,177

Note: All amounts in the table above are in $

JavaScript chart by amCharts 3.20.13

Resale Price Evaluation Methods

The property is sold after 30 years. Below is the resale price calculated using different methods.

Capitalization (11.19%) & NOI $ 310,876
Appreciation (3.00%) $ 424,771
Gross Rent Multiplier $ 310,957

Sale Proceeds

Projected Selling Price $ 310,876
Costs of Sale (3.50%) $ 10,881
Net Sale Proceeds Before Tax $ 299,995

In the resale analysis we do not include any calculation for taxes that might be owed on sale of the property. The tax laws for the resale are rather complex and subjected to frequent changes.

Net Assets and Yield

Net Assets
Sale Proceeds Before Tax $ 299,995
Investor Cash Outlay $ 43,550
Net Assets $ 256,445
Average Yield
Annual Net Assets $ 8,548
Average Cash Flow (After Taxes) $ 10,231
Average Annual Gain (After Taxes) $ 18,779
Average Annual Yield (After Taxes) 10.73 %
JavaScript chart by amCharts 3.20.13

This charts shows Net Present Value (NPV) when property is sold in various years, i.e. when sold in 5th year, the NPV is calculated from 5 years of Cash Flow (including the selling price) and this NPV is displayed in year 5. Optimal holding period can be estimated, using this method - when NPV is the highest. Please note that appreciation growth can change these numbers greatly. It sometimes makes sense to sell the property even before the end of the mortgage term.

Sign in to edit this report, add or compare properties. Don't have an acount? Sign up now!

BESbswy