Rylin Rentals


Property Report: 2918 NE 9th St, Ocala RENTAL

Property Report :

2918 NE 9th St, Ocala, FL 34470

Created on: Apr 15, 2025

Author: James Kennedy

Company: Rylin Rentals

2918 NE 9th St, Ocala, FL 34470

Singlefamily: 3 bedrooms , 2 bathrooms

Year built: 1962, Size: 1445 SF

Investment strategy: Rental Property

Purchase Price$ 199,500
Rent$ 1,500/mo
Monthly Cash Flow$ 781
Cash on Cash Return4.54 %

Financial Analysis

Cash on Cash Return 4.54 %
Internal Rate of Return (IRR) 6.06 %
Capitalization Rate 4.70 %
Gross Rent Multiplier (GRM) 11.08
Debt-coverage Ratio (DCR) 0.00
Operating Expense Ratio (OER) 42.15 %

Financial Breakdown

Purchase Price $ 199,500
Purchase Costs $ 7,000
Repair/Construction Costs $ 0
Total Capital Needed
$ 206,500
Financing $ 0
Total Cash Needed
$ 206,500
Cash at Closing
$ 0
Cash During Rehab
$ 206,500

Operating Analysis

Rent $ 1,500/mo
Gross Operating Income (GOI) $ 16,200
Total Expenses $ 6,828
Net Operating Income (NOI) $ 9,372
Annual Debt Service $ 0
Cash Flow Before Taxes (CFBT) $ 9,372
Income Tax Liability $ 892
Cash Flow After Taxes (CFAT) $ 8,480

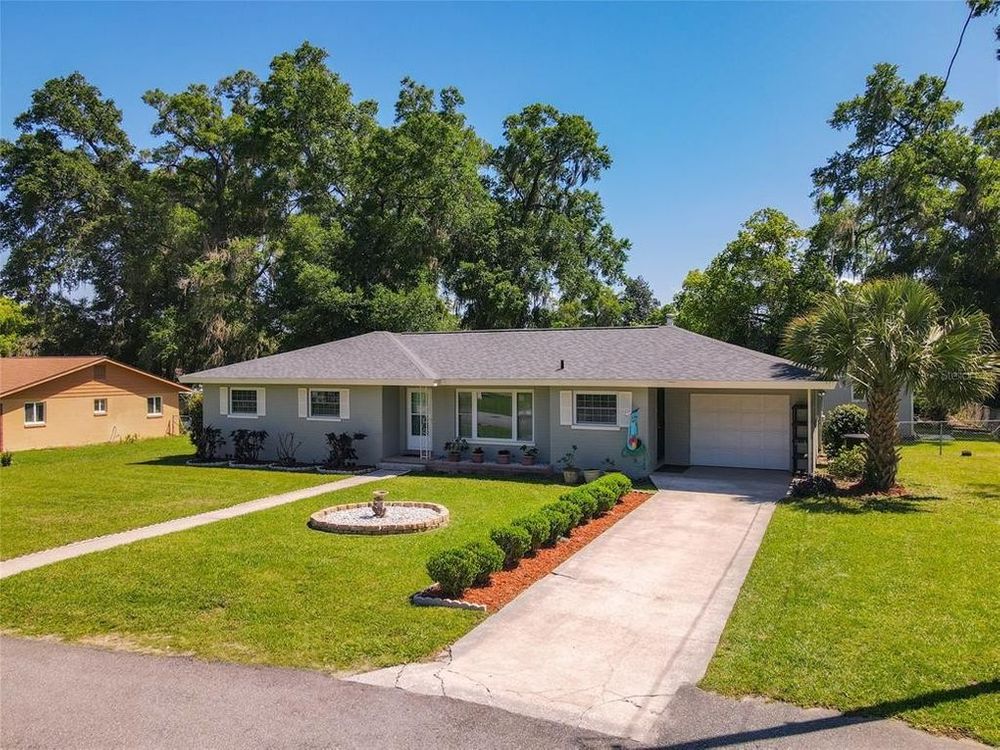
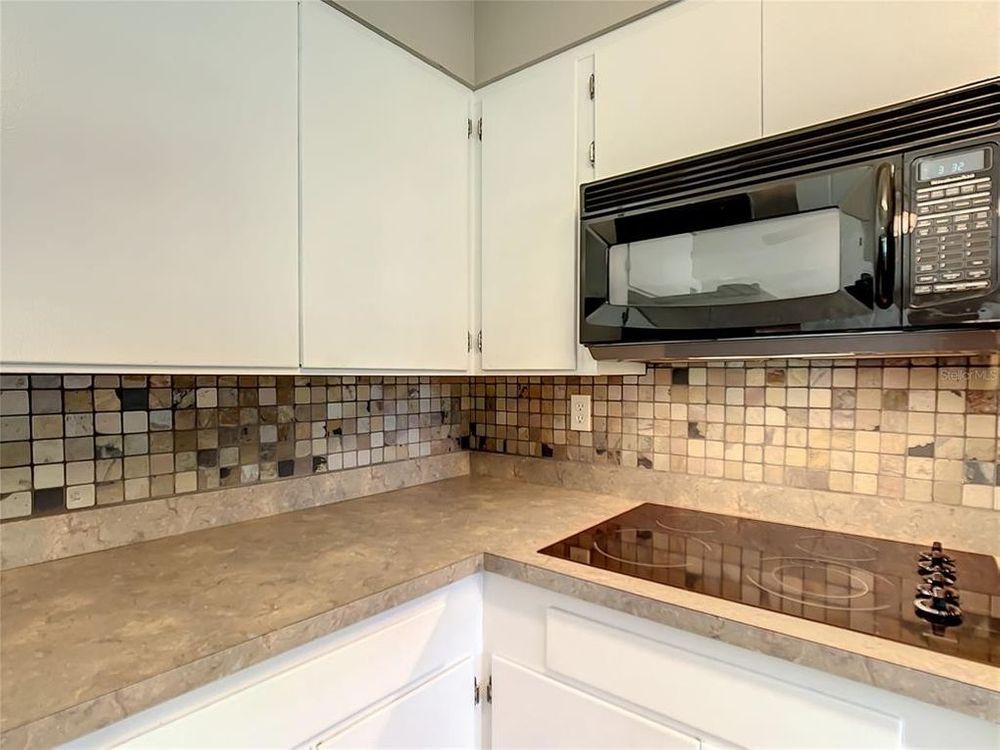
Immaculate 3/2, completely renovated home on almost 1/2 acre, chain link fenced yard! New roof (2021), new exterior and interior paint, all new window blinds, new light fixtures and fans, gorgeous hard wood floors, bathrooms updated with full tile, A/C in 2012, screened back porch overlooks large back yard in a park-like setting! Large detached storage building, paved road frontage, sits adjacent to Jim Kirk Park making the yard feel even larger with view of mature landscaping, expansive walking paths, and playground.....Located close to shopping, hospitals, schools and restaurants, and only minutes from the outdoor fun of the Silver Springs and National Forest areas filled with its lakes, springs, camping and rivers. Priced affordably, centrally located, and all the updates to this home make it a dream come true at $199, 500!

Purchase Price $ 199,500
Address 2918 NE 9th St , Ocala, 34470, FL
MLS® # OM635974
Listing Agent Sherri Meadows
Listing Broker KELLER WILLIAMS CORNERSTONE
Year Built 1962
Type Singlefamily
Size 1445 SF
Bedrooms 3
Bathrooms 2

Property History

Date Price Change Event
11/10/2005

Annual Property Operating Data

Incomes % of GOI
Gross Scheduled Income
$ 18,000    
Total Gross Income $ 18,000  
Vacancy loss
$ 1,800  
Gross Operating Income
$ 16,200 100.00 %
Expenses
Property manager $ 1,620 10.00 %
Utilities $ 600 3.70 %
Repairs $ 1,345 8.30 %
Association fees $ 1,752 10.81 %
Property tax $ 611 3.77 %
Insurance $ 900 5.56 %
Total Expenses $ 6,828 42.15 %
Net Operating Income
$ 9,372 57.85 %
JavaScript chart by amCharts 3.20.13
JavaScript chart by amCharts 3.20.13CFBTProperty managerUtilitiesRepairsAssociation feesProperty taxInsurance

Cash Flow (Year 1)

Net Operating Income $ 9,372 57.85 %
Annual Debt Service $ 0 0.00 %
Cash Flow Before Taxes (CFBT)
$ 9,372 57.85 %
Income Tax Liability $ 892 5.51 %
Cash Flow After Taxes (CFAT)
$ 8,480 52.35 %

Operating Ratios

Operating Expense Ratio
42.15 %
Break-Even Ratio
42.15 %

Financial Measures

Net Present Value
$ 18,388
Internal Rate of Return
6.06 %
Profitability Index
1.09
Annual Depreciation $ 5,804

Holding period of 10 years and discount rate of 5.00% were used for calculation of NPV and IRR. The rest of the financial measures are for the 1st year only and therefore don't provide such an exact information.

Investment Return Ratios

Cash on Cash Return
4.54 %
Return on Investment
7.44 %
Capitalization Rate
4.70 %
Gross Rental Yield
9.02 %
Gross Rent Multiplier
11.08

There is no financing selected in this deal.

JavaScript chart by amCharts 3.20.13Cummulative Equity vs Debt012345678910Year$ 0$ 100,000$ 200,000$ 300,000
JavaScript chart by amCharts 3.20.13Loan Principal Balance Equity: Principal Paid Equity: Cash Outlay Equity: Appreciation

This chart shows the process of accumulation of investor's equity. There is some equity created right at the beginning with the rehab/construction and later investor's equity is rising by paying off the principal of the loan and also by appreciation over the years. All the green parts is the cummulative equity belonging to the investor and the red part belongs to the lender.

Year 012345678910
Operational Analysis
Gross Scheduled Income 0 18,000 18,360 18,727 19,102 19,484 19,873 20,271 20,676 21,090 21,512
Vacancy Loss 0 1,800 1,836 1,873 1,910 1,948 1,987 2,027 2,068 2,109 2,151
Gross Operating Income 0 16,200 16,524 16,854 17,192 17,535 17,886 18,244 18,609 18,981 19,361
Expenses 0 6,828 6,964 7,103 7,246 7,390 7,538 7,689 7,843 8,000 8,160
Net Operating Income 0 9,372 9,560 9,751 9,946 10,145 10,348 10,555 10,766 10,981 11,201
Cash Flow
Repairs/Construction 0 0 0 0 0 0 0 0 0 0 0
Cash Flow Before Taxes -206,500 9,372 9,560 9,751 9,946 10,145 10,348 10,555 10,766 10,981 11,201
Depreciation 0 5,804 5,804 5,804 5,804 5,804 5,804 5,804 5,804 5,804 5,804
Taxes 0 892 939 987 1,036 1,085 1,136 1,188 1,240 1,294 1,349
Cash Flow After Taxes -206,500 8,480 8,621 8,764 8,911 9,060 9,212 9,367 9,525 9,687 9,852

Note: All amounts in the table above are in $

JavaScript chart by amCharts 3.20.13
JavaScript chart by amCharts 3.20.13GOINOICFBTCFAT

Resale Price Evaluation Methods

The property is sold after 10 years. Below is the resale price calculated using different methods.

Appreciation (3.00%) $ 268,111
Cap Rate (4.70%) & NOI $ 238,317
Gross Rent Multiplier $ 238,349

Sale Proceeds

Projected Selling Price $ 268,111
Costs of Sale (6.00%) $ 16,087
Net Sale Proceeds Before Tax $ 252,024

In the resale analysis we do not include any calculation for taxes that might be owed on sale of the property. The tax laws for the resale are rather complex and subjected to frequent changes.

Net Assets and Yield

Net Assets
Sale Proceeds Before Tax $ 252,024
Investor Cash Outlay $ 206,500
Net Assets $ 45,524
Average Yield
Annual Net Assets $ 4,552
Average Cash Flow (After Taxes) $ 8,163
Average Annual Gain (After Taxes) $ 12,715
Average Annual Yield (After Taxes) 6.37 %
JavaScript chart by amCharts 3.20.13

This charts shows Net Present Value (NPV) when property is sold in various years, i.e. when sold in 5th year, the NPV is calculated from 5 years of Cash Flow (including the selling price) and this NPV is displayed in year 5. Optimal holding period can be estimated, using this method - when NPV is the highest. Please note that appreciation growth can change these numbers greatly. It sometimes makes sense to sell the property even before the end of the mortgage term.

Sign in to edit this report, add or compare properties. Don't have an acount? Sign up now!

BESbswy