Bespoke Financial Inc
600 Superior Avenue Suite 1300
Cleveland, OH 44114
"Tailoring a plan to fit. You"

Property Report: Belle Solutions LLC - 255 S Princeton RENTAL

Property Report :

Belle Solutions LLC - 255 S Princeton

255 S Princeton Ave, Columbus, OH 43223

Created on: Apr 15, 2025

Author: Nehemiah Guy

Company: Bespoke Financial Inc

255 S Princeton Ave, Columbus, OH 43223

Singlefamily: 3 bedrooms , 1 bathroom

Year built: 1908, Size: 1152 SF

Investment strategy: Rental Property

Purchase Price$ 154,900
Rent$ 1,560/mo
Monthly Cash Flow$ 180
Cash on Cash Return21.65 %

Financial Analysis

Cash on Cash Return 21.65 %
Internal Rate of Return (IRR) 73.24 %
Capitalization Rate 6.39 %
Gross Rent Multiplier (GRM) 12.29
Debt-coverage Ratio (DCR) 1.17
Operating Expense Ratio (OER) 19.11 %
After Repair Value $ 230,000
Profit/Equity From Rehab $ 65,100

Financial Breakdown

Purchase Price $ 154,900
Purchase Costs $ 10,000
Repair/Construction Costs $ 0
Total Capital Needed
$ 164,900
Financing $ 154,900
Total Cash Needed
$ 10,000
Cash at Closing
$ 0
Cash During Rehab
$ 10,000

Operating Analysis

Rent $ 1,560/mo
Gross Operating Income (GOI) $ 18,158
Total Expenses $ 3,470
Net Operating Income (NOI) $ 14,688
Annual Debt Service $ 12,523
Cash Flow Before Taxes (CFBT) $ 2,165
Income Tax Liability $ -201
Cash Flow After Taxes (CFAT) $ 2,367

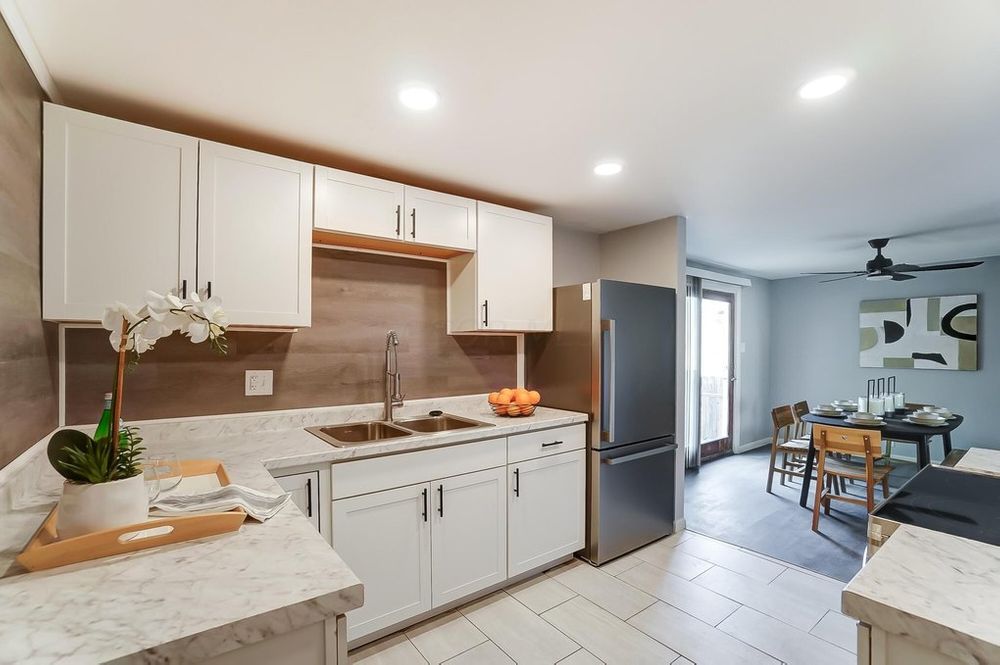
This home qualifies for up to 100% financing Welcome to 255 S Princeton Ave, just minutes from Downtown Columbus! This newly renovated home offers three bedrooms and one full bathroom with modern upgrades throughout. The kitchen boasts brand-new granite countertops, stainless steel appliances, and recessed lighting. Fresh paint and new flooring create a bright, modern atmosphere, while the newly installed central air unit, furnace, and water heater ensure comfort and reliability. Outside, enjoy a private fenced backyard and a two-car detached garage, perfect for outdoor gatherings and storage. With its stylish upgrades and prime location, this move-in-ready home offers comfort and convenience in a vibrant neighborhood.

Purchase Price $ 154,900
Address 255 S Princeton Ave , Columbus, 43223, OH
MLS® # 224032297
Listing Agent Kristina Belle
Year Built 1908
Type Singlefamily
Size 1152 SF
Bedrooms 3
Bathrooms 1

Property History

Date Price Change Event
10/7/2024 229800 Price Changed
9/18/2024 234900 Price Changed
9/10/2024 240000 Listed
5/16/2024 154900 Sold
5/14/2024 144000 Sold
4/12/2024 Listing removed
4/9/2024 160000 Listed
255 S Princeton Ave Columbus, OH 43223
  • $ 230,000

    Property ARV
  • Singlefamily

    Bldg type
  • 1,152

    SqFt
  • $ 200

    per SqFt
  • 3

    Beds
  • 1

    Baths
255 S Princeton Ave Columbus, OH 43223
  • $ 1,560

    Rent
  • Singlefamily

    Bldg type
  • 1,152

    SqFt
  • 3

    Beds
  • 1

    Baths

Your rent is reasonable for the area.

Average

$ 1,424 

Median

$ 1,400

25th %

$ 1,289

75th %

$ 1,560

# Property address Similarity Distance Beds Baths SqFt Date Listed Bldg type Rent
1 130 Chicago Ave
94%
0.9mi 3 1 1,152 9/23/2024 Single Family $ 1,600
2 165 S Princeton Ave
93%
0.2mi 3 1 1,240 5/30/2024 Single Family $ 1,350
3 58 N Yale Ave
92%
0.8mi 3 1 1,056 10/31/2024 Single Family $ 1,489

You can edit, sort, drag and reorder suggested comps below. Select the comps you want to include in the report. You can also add comps manually.

Property address Similarity Distance Beds Baths SqFt Date Listed Bldg type Rent Notes Edit
130 Chicago Ave
94%
0.9mi 3 1 1,152 9/23/2024 Single Family $ 1,600
74 Stevens Ave
93%
0.9mi 3 1 1,170 7/1/2024 Single Family $ 1,240
87 N Yale Ave
93%
0.5mi 3 1 1,215 8/18/2024 Single Family $ 1,225
165 S Princeton Ave
93%
0.2mi 3 1 1,240 5/30/2024 Single Family $ 1,350
299 Brehl Ave
93%
0.2mi 3 1 1,068 6/18/2024 Single Family $ 1,174
85 N Yale Ave
93%
0.8mi 3 1 1,215 10/13/2024 Single Family $ 1,225
191 Dana Ave
93%
0.2mi 3 1 1,276 10/31/2024 Single Family $ 1,150
Lechner Ave, Unit 332
92%
1.6mi 3 1 1,120 8/4/2024 Single Family $ 1,100
58 N Yale Ave
92%
0.8mi 3 1 1,056 10/31/2024 Single Family $ 1,489
330 Midland Ave
92%
2.0mi 3 1 1,148 7/4/2024 Single Family $ 995

Comps selected: 3

Annual Property Operating Data

Incomes % of GOI
Gross Scheduled Income
$ 18,720    
Total Gross Income $ 18,720  
Vacancy loss
$ 562  
Gross Operating Income
$ 18,158 100.00 %
Expenses
Insurance $ 1,200 6.61 %
Property tax $ 2,270 12.50 %
Total Expenses $ 3,470 19.11 %
Net Operating Income
$ 14,688 80.89 %
JavaScript chart by amCharts 3.20.13

Cash Flow (Year 1)

Net Operating Income $ 14,688 80.89 %
Annual Debt Service $ 12,523 68.97 %
Cash Flow Before Taxes (CFBT)
$ 2,165 11.92 %
Income Tax Liability $ -201 -1.11 %
Cash Flow After Taxes (CFAT)
$ 2,367 13.03 %

Operating Ratios

Operating Expense Ratio
19.11 %
Break-Even Ratio
88.08 %

Financial Measures

Net Present Value
$ 83,828
Internal Rate of Return
73.24 %
Profitability Index
9.38
Annual Depreciation $ 4,506

Holding period of 5 years and discount rate of 5.00% were used for calculation of NPV and IRR. The rest of the financial measures are for the 1st year only and therefore don't provide such an exact information.

Investment Return Ratios

Cash on Cash Return
21.65 %
Return on Investment
68.12 %
Capitalization Rate
6.39 %
Gross Rental Yield
12.09 %
Gross Rent Multiplier
12.29
Financing % of ARV
Down Payment $ 0 0.00 %
Loan $ 154,900 67.35 %
Loan to Value Ratio
100.00 %
Loan to Cost Ratio
100.00 %
Debt Coverage Ratio 1.17
Loan

Financing of: Purchase price ($ 154,900)

Type Amortized
Loan Amount $ 154,900
Down payment (0%) $ 0
Amortization 30 years
Interest Rate 7.13 %
Monthly Payment $ 1,043.59
JavaScript chart by amCharts 3.20.13

This chart shows the process of accumulation of investor's equity. There is some equity created right at the beginning with the rehab/construction and later investor's equity is rising by paying off the principal of the loan and also by appreciation over the years. All the green parts is the cummulative equity belonging to the investor and the red part belongs to the lender.

Year 012345
Operational Analysis
Gross Scheduled Income 0 18,720 19,094 19,476 19,866 20,263
Vacancy Loss 0 562 573 584 596 608
Gross Operating Income 0 18,158 18,522 18,892 19,270 19,655
Expenses 0 3,470 3,539 3,610 3,682 3,756
Net Operating Income 0 14,688 14,982 15,282 15,587 15,899
Loan Payment 0 12,523 12,523 12,523 12,523 12,523
Payment Interest Part 0 10,987 10,874 10,753 10,622 10,482
Payment Principal Part 0 1,536 1,649 1,770 1,901 2,041
Cash Flow
Repairs/Construction 0 0 0 0 0 0
Cash Flow Before Taxes -10,000 2,165 2,459 2,759 3,064 3,376
Depreciation 0 4,506 4,506 4,506 4,506 4,506
Taxes 0 -201 -99 6 115 228
Cash Flow After Taxes -10,000 2,367 2,559 2,753 2,950 3,148

Note: All amounts in the table above are in $

JavaScript chart by amCharts 3.20.13

Resale Price Evaluation Methods

The property is sold after 5 years. Below is the resale price calculated using different methods.

Appreciation (3.00%) $ 266,633
Cap Rate (6.39%) & NOI $ 248,814
Gross Rent Multiplier $ 249,034

Sale Proceeds

Projected Selling Price $ 266,633
Costs of Sale (6.00%) $ 15,998
1. Loan Balance Payoff $ 146,003
Net Sale Proceeds Before Tax $ 104,632

In the resale analysis we do not include any calculation for taxes that might be owed on sale of the property. The tax laws for the resale are rather complex and subjected to frequent changes.

Net Assets and Yield

Net Assets
Sale Proceeds Before Tax $ 104,632
Investor Cash Outlay $ 10,000
Net Assets $ 94,632
Average Yield
Annual Net Assets $ 18,926
Average Cash Flow (After Taxes) $ 2,126
Average Annual Gain (After Taxes) $ 21,052
Average Annual Yield (After Taxes) 13.59 %
JavaScript chart by amCharts 3.20.13

This charts shows Net Present Value (NPV) when property is sold in various years, i.e. when sold in 5th year, the NPV is calculated from 5 years of Cash Flow (including the selling price) and this NPV is displayed in year 5. Optimal holding period can be estimated, using this method - when NPV is the highest. Please note that appreciation growth can change these numbers greatly. It sometimes makes sense to sell the property even before the end of the mortgage term.

Sign in to edit this report, add or compare properties. Don't have an acount? Sign up now!

BESbswy