{{ label }}

Real Estate Analysis


Property Report: PARIS RENTAL RENTAL
Property Report :
PARIS RENTAL
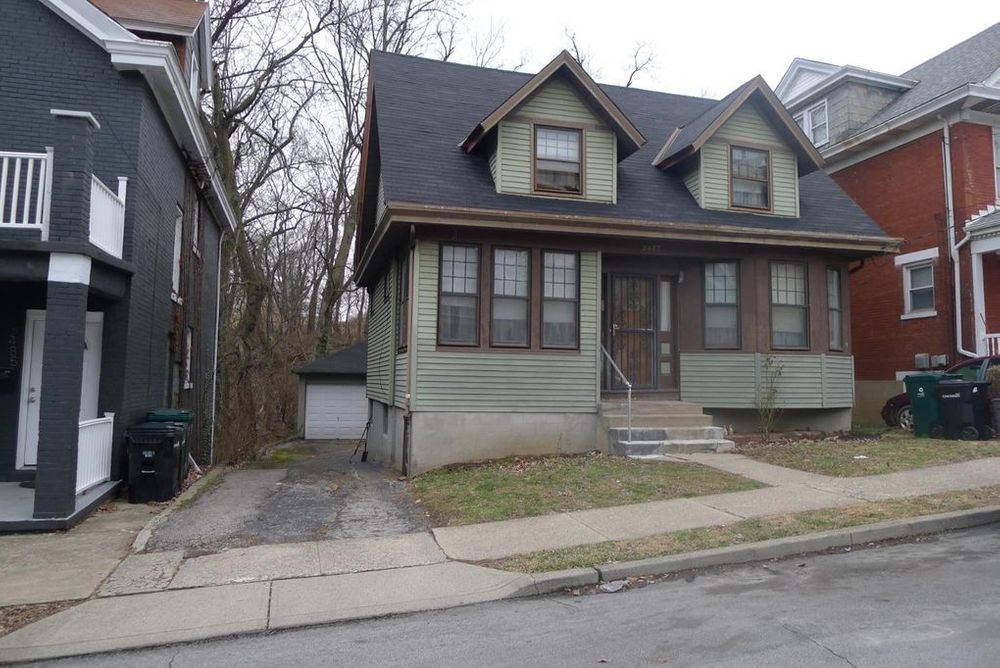
2487 Paris St, Cincinnati, OH 45219
Powered by
Real Estate Analysis
![]()
Created on: Jul 30, 2025
Author: Lisa WIlliams
Company: Keller Williams Seven Hills
Executive Summary
2487 Paris St, Cincinnati, OH 45219
Singlefamily: 3 bedrooms , 1 bathroom
Year built: 1908, Size: 1538 SF
Investment strategy: Rental Property
Purchase Price$ 121,000
Rent$ 1,800/mo
Monthly Cash Flow$ 1,492
Cash on Cash Return11.81 %
Financial Analysis
| Cash on Cash Return | 11.81 % |
| Internal Rate of Return (IRR) | 10.18 % |
| Capitalization Rate | 14.79 % |
| Gross Rent Multiplier (GRM) | 5.60 |
| Debt-coverage Ratio (DCR) | 0.00 |
| Operating Expense Ratio (OER) | 17.13 % |
Financial Breakdown
| Purchase Price | $ 121,000 |
| Purchase Costs | $ 600 |
| Repair/Construction Costs | $ 30,000 |
| $ 151,600 | |
| Financing | $ 0 |
| $ 151,600 | |
| $ 0 | |
| $ 151,600 |
Operating Analysis
| Rent | $ 1,800/mo |
| Gross Operating Income (GOI) | $ 21,600 |
| Total Expenses | $ 3,700 |
| Net Operating Income (NOI) | $ 17,900 |
| Annual Debt Service | $ 0 |
| Cash Flow Before Taxes (CFBT) | $ 17,900 |
| Income Tax Liability | $ 3,595 |
| Cash Flow After Taxes (CFAT) | $ 14,305 |
Property Description
2487 Paris St, Cincinnati, OH 45219 is a single family home built in 1908. According to the Cincinnati public records, the property at 2487 Paris St, Cincinnati, OH 45219 has approximately 1538 square feet, 3 beds and 1 baths with a lot size of 5,009 square feet. Nearby schools include William H Taft Elementary School.
| Purchase Price | $ 121,000 |
| Address | 2487 Paris St , Cincinnati, 45219, OH |
| Listing Agent | Michael W Jordan |
| Listing Broker | Jordan, Inc. |
| Year Built | 1908 |
| Type | Singlefamily |
| Size | 1538 SF |
| Bedrooms | 3 |
| Bathrooms | 1 |
Property History
| Date | Price | Change | Event |
|---|---|---|---|
| 2/25/2022 |
Operating Analysis
Financial Analysis
Financing Overview
Long-term Cash Flow Forecast
Resale Analysis
Photos
Sign in to edit this report, add or compare properties. Don't have an acount? Sign up now!