{{ label }}

Real Estate Analysis


Property Report: 2401 Greenlawn St, Lake Charles RENTAL
Property Report :
2401 Greenlawn St, Lake Charles, LA 70607
Powered by
Real Estate Analysis
![]()
Created on: Apr 16, 2025
Author: Alexis Hornsby
Company: Hornsby Rental Properties
Executive Summary
2401 Greenlawn St, Lake Charles, LA 70607
Multifamily: 4 rooms: 4 bedrooms , 3 bathrooms
Year built: 1969, Size: 1459 SF
Investment strategy: Rental Property
Purchase Price$ 150,000
Rent$ 1,750/mo
Monthly Cash Flow$ -4,172
Cash on Cash Return-80.12 %
Financial Analysis
| Cash on Cash Return | -80.12 % |
| Internal Rate of Return (IRR) | 6.13 % |
| Capitalization Rate | 3.64 % |
| Gross Rent Multiplier (GRM) | 9.52 |
| Debt-coverage Ratio (DCR) | 0.36 |
| Operating Expense Ratio (OER) | 60.58 % |
| After Repair Value | $ 200,000 |
| Profit/Equity From Rehab | $ 23,690 |
Financial Breakdown
| Purchase Price | $ 150,000 |
| Purchase Costs | $ 11,310 |
| Repair/Construction Costs | $ 15,000 |
| $ 176,310 | |
| Financing | $ 160,000 |
| $ 16,310 | |
| $ 2,560 | |
| $ 13,750 |
Operating Analysis
| Rent | $ 1,750/mo |
| Gross Operating Income (GOI) | $ 18,480 |
| Total Expenses | $ 11,196 |
| Net Operating Income (NOI) | $ 7,284 |
| Annual Debt Service | $ 20,352 |
| Cash Flow Before Taxes (CFBT) | $ -50,068 |
| Income Tax Liability | $ -4,358 |
| Cash Flow After Taxes (CFAT) | $ -45,710 |
Property Description
| Purchase Price | $ 150,000 |
| Address | 2401 Greenlawn St , Lake Charles, 70607, LA |
| MLS® # | SWL22009002 |
| Year Built | 1969 |
| Type | Multifamily |
| Number of Units | 2 |
| Size | 1459 SF |
| Bedrooms | 4 |
| Bathrooms | 3 |
| Rooms Total | 4 |
| Unit | Rent |
|---|---|
| Small 1b/1b | $ 750/mo |
| Big 3b/2b | $ 1,000/mo |
2401 Greenlawn St Lake Charles, LA 70607
-
$ 200,000
Property ARV
-
Multifamily
Bldg type
-
1,459
SqFt
-
$ 137
per SqFt
-
4
Beds
-
3
Baths
Comparative Rental Analysis
2401 Greenlawn St Lake Charles, LA 70607
-
$ 1,750
Rent
-
Multifamily
Bldg type
-
1,459
SqFt
-
4
Beds
-
3
Baths
Your rent may be too high.
Average
$ 1,008
Median
$ 968
25th %
$ 922
75th %
$ 1,094
Operating Analysis
Financial Analysis
Financing Overview
Long-term Cash Flow Forecast
Resale Analysis
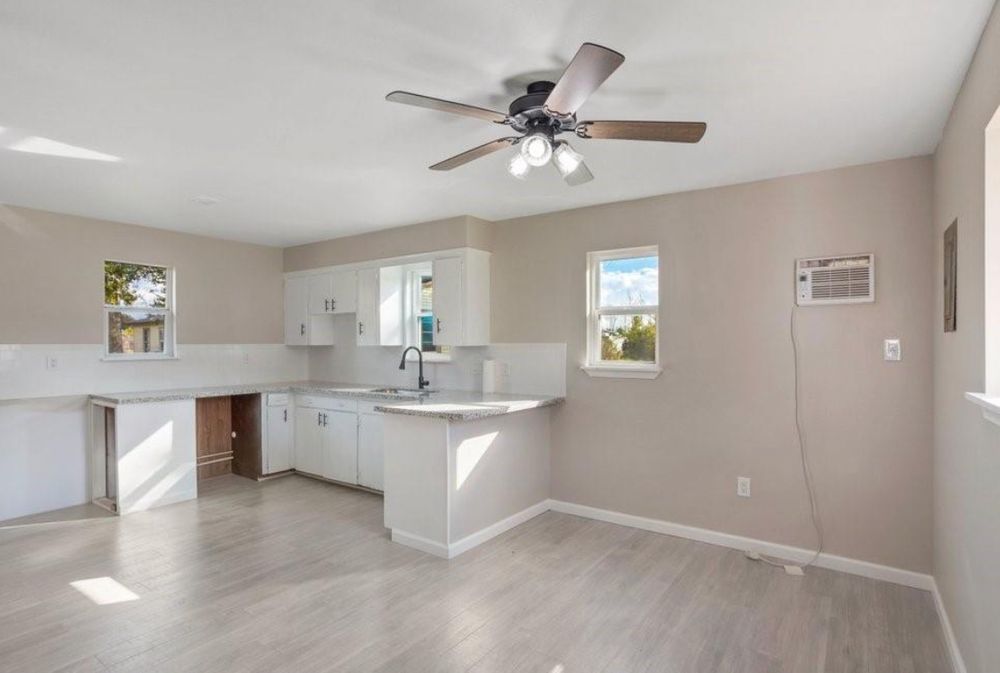
Photos
Sign in to edit this report, add or compare properties. Don't have an acount? Sign up now!