Property Report: 23 Church Road, Grand Falls-Windsor RENTAL
Property Report :
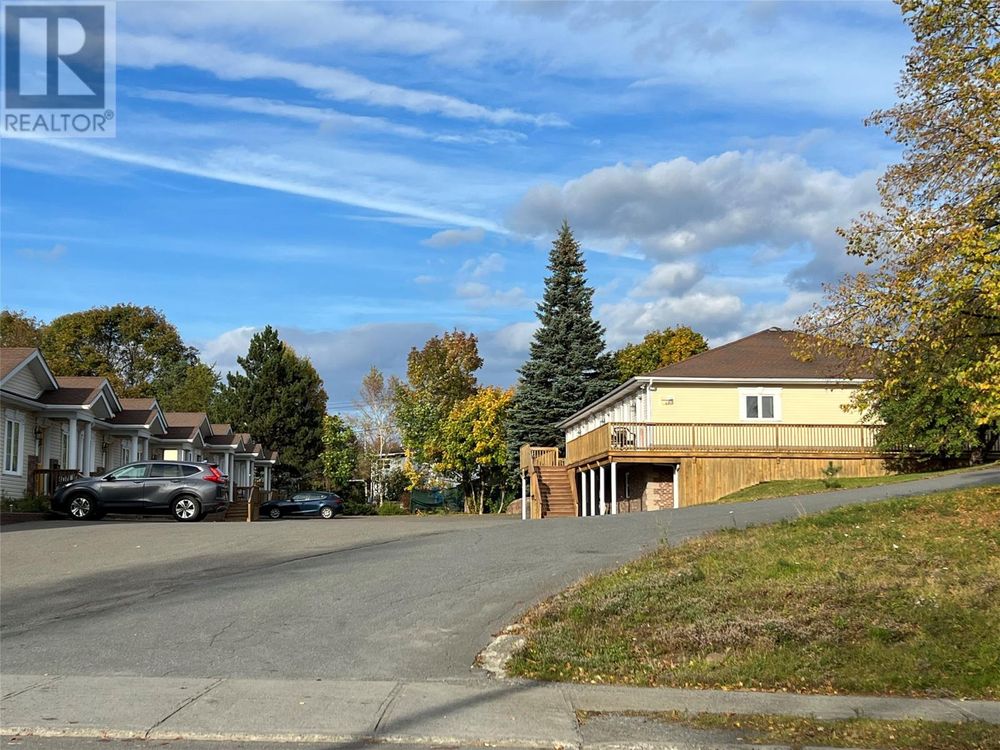
23 Church Road, Grand Falls-Windsor, NL A2A1Z4

Powered by
Real Estate Analysis
Created on: Apr 14, 2025
Author: Steve Marsh
Executive Summary
23 Church Road, Grand Falls-Windsor, NL A2A1Z4
Multi-Family:
Year built: 2008, Size: 13339 SF
Investment strategy: Rental Property

Financial Analysis
| Cash on Cash Return | 7.07 % |
| Internal Rate of Return (IRR) | 18.74 % |
| Capitalization Rate | 7.84 % |
| Gross Rent Multiplier (GRM) | 8.93 |
| Debt-coverage Ratio (DCR) | 1.22 |
| Operating Expense Ratio (OER) | 27.79 % |
Financial Breakdown
| Purchase Price | $ 1,200,000 |
| Purchase Costs | $ 0 |
| Repair/Construction Costs | $ 0 |
| $ 1,200,000 | |
| Financing | $ 960,000 |
| $ 240,000 | |
| $ 240,000 | |
| $ 0 |
Operating Analysis
| Rent | $ 11,200/mo |
| Gross Operating Income (GOI) | $ 130,368 |
| Total Expenses | $ 36,232 |
| Net Operating Income (NOI) | $ 94,136 |
| Annual Debt Service | $ 77,164 |
| Cash Flow Before Taxes (CFBT) | $ 16,972 |
| Income Tax Liability | $ -469 |
| Cash Flow After Taxes (CFAT) | $ 17,442 |
Property Description
ATTENTION INVESTORS DON'T MISS OUT ON THE OPPORTUNITY TO OWN THESE WELL CONSTRUCTED UNITS! These adult living rental units are centrally located in the town of Grand Falls-Windsor within walking distance to downtown, several churches & Church Road Park makes these units a desirable location to live. This property being sold as a package deal including original main house which was extensively renovated in 2008 plus 3 other buildings consisting of 10 units constructed in 2008. Main house (approx. 1417 SF) consists of main floor living room, dining room-kitchen combination, 2 piece bath, front & rear foyers; second floor has 2 spacious bedrooms & full bathroom; full basement utilized for laundry & storage. Two buildings (approx. 3564 SF per building) both contain 3 self contained 2 bedroom units with a full basement under both buildings. Half of both basements utilized for landlords use with separate meters & a half bath in one section. Third building (approx. 4,794 SF including main floor units & ground level unit) has 3 - 2 bedroom units on main floor with a spacious ground level 2 bedroom unit. Nine of the 2 bedroom main floor units all have a partial basement area for storage & utility area. All units include fridge, stove, dishwasher, washer & dryers. Lot has been fully landscaped with numerous planters & decks in place; plenty of asphalt parking in place for tenants. (27471152)
| Purchase Price | $ 1,200,000 |
| Address | 23 Church Road , Grand Falls-Windsor, A2A1Z4, NL, CA |
| MLS® # | 1264725 |
| Year Built | 2008 |
| Type | Multi-Family |
| Size | 13339 SF |

Operating Analysis
Financial Analysis
Financing Overview
Long-term Cash Flow Forecast
Resale Analysis
Photos


Sign in to edit this report, add or compare properties. Don't have an acount? Sign up now!