{{ label }}


Real Estate Analysis


Property Report: 2212 E 93rd St, Cleveland RENTAL
Property Report :
2212 E 93rd St, Cleveland, OH 44106
Powered by
Real Estate Analysis
![]()
Created on: Apr 14, 2025
Author: Guardian City
Executive Summary
2212 E 93rd St, Cleveland, OH 44106
Investment strategy: Rental Property
Purchase Price$ 310,000
Rent$ 4,125/mo
Monthly Cash Flow$ 1,361
Cash on Cash Return21.08 %
Financial Analysis
| Cash on Cash Return | 21.08 % |
| Internal Rate of Return (IRR) | 24.23 % |
| Capitalization Rate | 9.96 % |
| Gross Rent Multiplier (GRM) | 6.26 |
| Debt-coverage Ratio (DCR) | 2.12 |
| Operating Expense Ratio (OER) | 34.32 % |
Financial Breakdown
| Purchase Price | $ 310,000 |
| Purchase Costs | $ 0 |
| Repair/Construction Costs | $ 0 |
| $ 310,000 | |
| Financing | $ 232,500 |
| $ 77,500 | |
| $ 77,500 | |
| $ 0 |
Operating Analysis
| Rent | $ 4,125/mo |
| Gross Operating Income (GOI) | $ 47,025 |
| Total Expenses | $ 16,137 |
| Net Operating Income (NOI) | $ 30,888 |
| Annual Debt Service | $ 14,554 |
| Cash Flow Before Taxes (CFBT) | $ 16,334 |
| Income Tax Liability | $ 2,726 |
| Cash Flow After Taxes (CFAT) | $ 13,608 |
Operating Analysis
Financing Overview
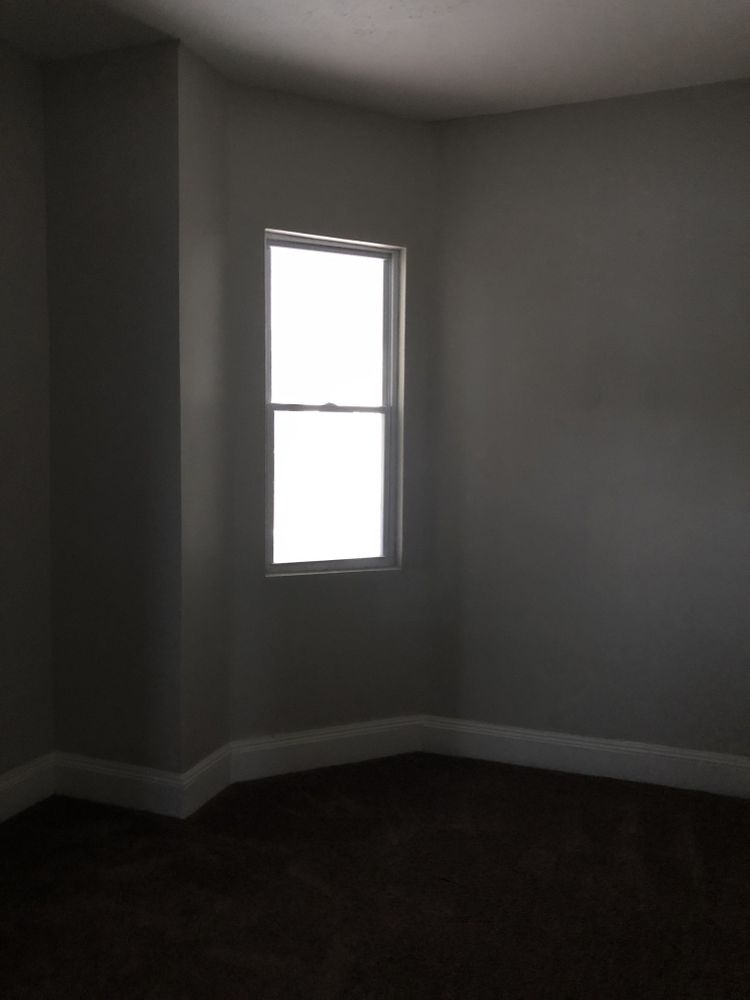
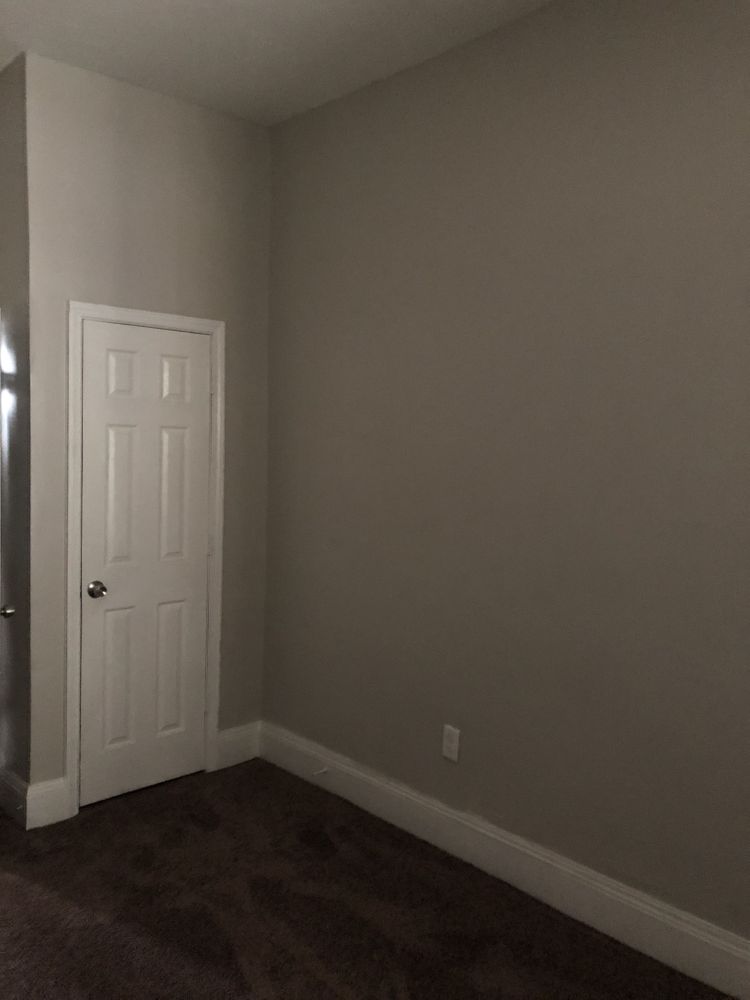
Photos
Sign in to edit this report, add or compare properties. Don't have an acount? Sign up now!