{{ label }}


Real Estate Analysis


Property Report: 219 Bodmann Ave, Cincinnati RENTAL
Property Report :
219 Bodmann Ave, Cincinnati, OH 45219
Powered by
Real Estate Analysis
![]()
Created on: Apr 16, 2025
Author: Lisa WIlliams
Company: Keller Williams Seven Hills
Executive Summary
219 Bodmann Ave, Cincinnati, OH 45219
Multifamily:
Year built: 1887,
Investment strategy: Rental Property
Purchase Price$ 1,100,000
Rent$ 10,781/mo
Monthly Cash Flow$ 5,024
Cash on Cash Return27.22 %
Financial Analysis
| Cash on Cash Return | 27.22 % |
| Internal Rate of Return (IRR) | 29.27 % |
| Capitalization Rate | 9.93 % |
| Gross Rent Multiplier (GRM) | 8.50 |
| Debt-coverage Ratio (DCR) | 2.23 |
| Operating Expense Ratio (OER) | 12.85 % |
Financial Breakdown
| Purchase Price | $ 1,100,000 |
| Purchase Costs | $ 1,500 |
| Repair/Construction Costs | $ 0 |
| $ 1,101,500 | |
| Financing | $ 880,000 |
| $ 221,500 | |
| $ 220,000 | |
| $ 1,500 |
Operating Analysis
| Rent | $ 10,781/mo |
| Gross Operating Income (GOI) | $ 125,361 |
| Total Expenses | $ 16,106 |
| Net Operating Income (NOI) | $ 109,255 |
| Annual Debt Service | $ 48,965 |
| Cash Flow Before Taxes (CFBT) | $ 60,291 |
| Income Tax Liability | $ 11,111 |
| Cash Flow After Taxes (CFAT) | $ 49,180 |
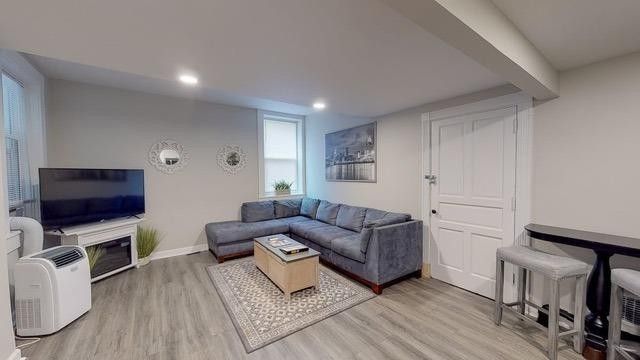
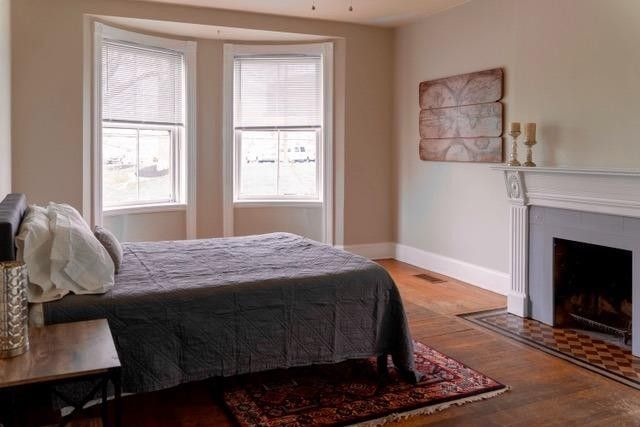
Property Description
Exciting opportunity to invest in this beautiful and historic 9 unit building close to downtown, UC and hospitals! 5 units FULLY remodeled with new floors, baths, kitchens, electric and central heat and AC! New rubber roof, new windows installed! $100k/yr gross with room to grow.
| Purchase Price | $ 1,100,000 |
| Address | 219 Bodmann Ave , Cincinnati, 45219, OH |
| MLS® # | 1704017 |
| Listing Agent | David Skvorak |
| Listing Broker | Comey & Shepherd |
| Year Built | 1887 |
| Type | Multifamily |
| Number of Units |
Property History
| Date | Price | Change | Event |
|---|---|---|---|
| 11/24/2009 | |||
| 10/13/1998 |
Operating Analysis
Financial Analysis
Financing Overview
Long-term Cash Flow Forecast
Resale Analysis
Photos
Sign in to edit this report, add or compare properties. Don't have an acount? Sign up now!