Property Report: Cleveland Property RENTAL
Property Report :
Cleveland Property
2145 W 103rd St, Cleveland, OH 44102

Powered by
Real Estate Analysis
![]()
Created on: Apr 15, 2025
Author: Guardian City
Executive Summary
2145 W 103rd St, Cleveland, OH 44102
Singlefamily: 6 rooms: 3 bedrooms , 1.5 bathrooms
Year built: 1910, Size: 1276 SF
Investment strategy: Rental Property
Most of our numbers reflect fixed costs only and do not account for variable numbers, positive or negative; such as maintenance, home warranties, vacancies, rent increases, depreciation of costs, or appreciation of value. Total potential Return of Investment (ROI) is based on calculations of external data and is subject to change. Estimated returns are estimated as gross returns, and do not factor in vacancy and maintenance. Limitless Turnkey has offered this estimator of ROI in good faith. We realize that there are alternate methods to calculate ROI, and that some assumptions may not be applicable for your calculations. Data provided for the calculation is the user’s responsibility. We do not make any representations or warranties of any kind on the information provided. We also disclaim any liability or responsibility for the accuracy, correctness, or completeness of any information provided.

Financial Analysis
| Cash on Cash Return | 22.52 % |
| Internal Rate of Return (IRR) | 25.15 % |
| Capitalization Rate | 10.60 % |
| Gross Rent Multiplier (GRM) | 5.86 |
| Debt-coverage Ratio (DCR) | 2.13 |
| Operating Expense Ratio (OER) | 34.61 % |
| After Repair Value | $ 54,500 |
Financial Breakdown
| Purchase Price | $ 54,500 |
| Purchase Costs | $ 0 |
| Repair/Construction Costs | $ 0 |
| $ 54,500 | |
| Financing | $ 40,875 |
| $ 13,625 | |
| $ 13,625 | |
| $ 0 |
Operating Analysis
| Rent | $ 775/mo |
| Gross Operating Income (GOI) | $ 8,835 |
| Total Expenses | $ 3,058 |
| Net Operating Income (NOI) | $ 5,777 |
| Annual Debt Service | $ 2,709 |
| Cash Flow Before Taxes (CFBT) | $ 3,069 |
| Income Tax Liability | $ 515 |
| Cash Flow After Taxes (CFAT) | $ 2,554 |
Operating Analysis
Financing Overview
Lender Report
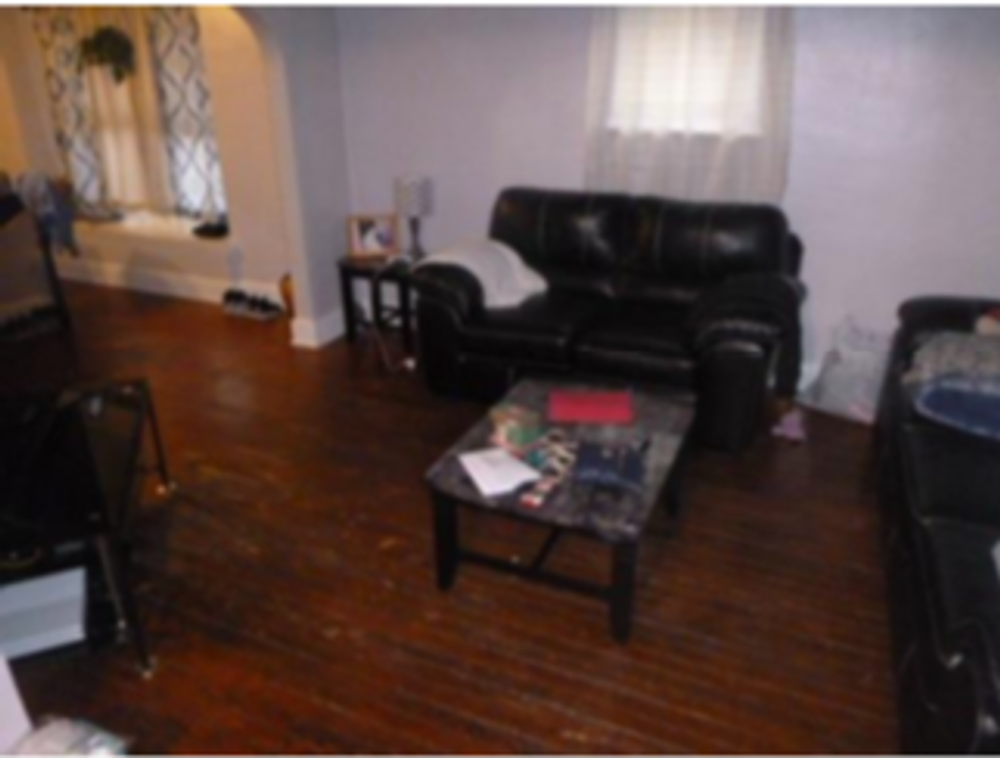
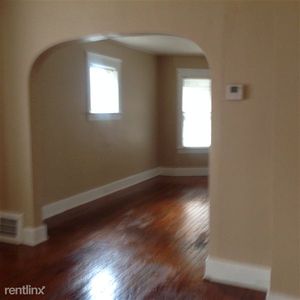
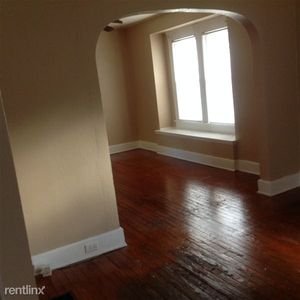
Photos


Sign in to edit this report, add or compare properties. Don't have an acount? Sign up now!