Shawna Gauger
Wagner Realty
Manatee County
941-779-4881

Property Report: 2017 12TH ST W #A&B, Bradenton RENTAL PUBLISHED
Property Report :
2017 12TH ST W #A&B, Bradenton, FL 34205

Powered by

Real Estate Analysis
Created on: Apr 15, 2025
Author: Shawna Smallwood Gauger
Company: Shawna Gauger
Executive Summary
2017 12TH ST W #A&B, Bradenton, FL 34205
Multifamily: 4 bedrooms , 2 bathrooms
Year built: 1947, Size: 1749 SF
Investment strategy: Rental Property
Two very attractive cottages on one parcel (Save on property taxes!) Both are separately metered for water and electric. Updates completed. Purchased for 60,000 in 2015. Unit B Maintains Property.
Financial Analysis
Cash on Cash Return | 7.99 % |
Internal Rate of Return (IRR) | 8.03 % |
Capitalization Rate | 8.02 % |
Gross Rent Multiplier (GRM) | 10.11 |
Debt-coverage Ratio (DCR) | 0.00 |
Operating Expense Ratio (OER) | 15.46 % |
Financial Breakdown
Purchase Price | $ 169,900 |
Purchase Costs | $ 633 |
Repair/Construction Costs | $ 0 |
Total Capital Needed
Includes all projects costs (except selling costs).
Total Capital Needed
Includes all projects costs (except selling costs).
|
$ 170,533 |
Financing | $ 0 |
Total Cash Needed
Cash out of Pocket
Shows rehabber's cash outlay.
Cash out of Pocket
Shows rehabber's cash outlay.
|
$ 170,533 |
Cash at Closing
Cash at Closing
This number includes down payment and loan points.
Cash at Closing
This number includes down payment and loan points.
|
$ 0 |
Cash During Rehab
Cash During Rehab
Shows the cash amount remaining to fund the purchase and rehab/construction.
Cash During Rehab
Shows the cash amount remaining to fund the purchase and rehab/construction.
|
$ 170,533 |
Operating Analysis
Rent | $ 1,400/mo |
Gross Operating Income (GOI) | $ 16,128 |
Total Expenses | $ 2,494 |
Net Operating Income (NOI) | $ 13,634 |
Annual Debt Service | $ 0 |
Cash Flow Before Taxes (CFBT) | $ 13,634 |
Income Tax Liability | $ 2,173 |
Cash Flow After Taxes (CFAT) | $ 11,461 |
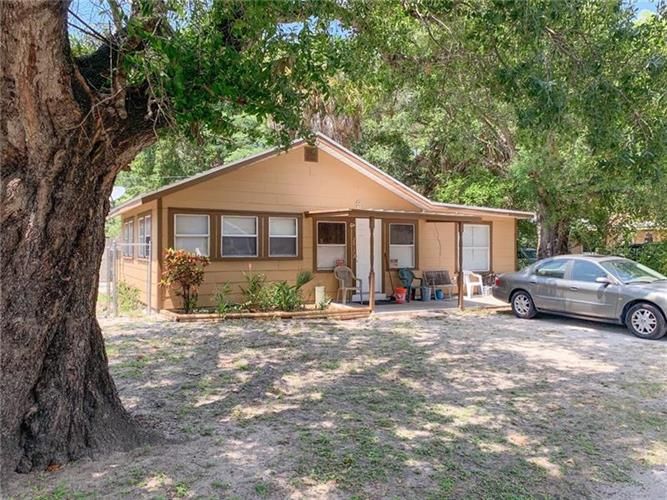
Property Description
Two very attractive cottages on one parcel (Save on property taxes!) Both are separately metered for water and electric. Numerous updates include newer CENTRAL AIR and updated electric & plumbing and ROOFS! Unit A (2 Bed/1Bath 1, 029sft) rents for $850 per month has washer/dryer hookup. Unit B (1-2Bed/1Bath 720sft) rents for $550- tenant does maintenance. Both currently rented. Approx 120x60 foot lot, newer fence for back yards. Corner lot, close to ball field, bus line and more! Sold as is with the right to inspect. Showings by appointment only, please do not walk property or disturb occupants without prior arrangements being made.
Purchase Price | $ 169,900 |
Address | 2017 12TH ST W #A&B , Bradenton, 34205, FL |
MLS® # | A4468325 |
Listing Broker | Re/Max Alliance Group |
Year Built | 1947 |
Type | Multifamily |
Number of Units | 2 |
Size | 1749 SF |
Bedrooms | 4 |
Bathrooms | 2 |


Unit | Rent |
---|---|
A | $ 850/mo |
B | $ 550/mo |
Comparative Sales Analysis

-
Multifamily
Bldg type
-
1,749
SqFt
-
4
Beds
-
2
Baths


# | Property address | Distance | Beds | Baths | SqFt | Bldg type | Date sold | Sale price | $/SqFt | Notes |
---|---|---|---|---|---|---|---|---|---|---|
1 | 2038 19th Ave W | 0.6mi | 4 | 4 | 1,520 | 12/26/2019 | $ 185,000 | $ 122 | ||
2 | 1826 13th St W | 0.1mi | 6 | 2 | 1,695 | 11/06/2019 | $ 110,000 | $ 65 | 2/1 & 4/1 | |
3 | 619 21st St W | 1.0mi | 4 | 2.0 | 1,658 | 10/15/2019 | $ 213,157 | $ 129 | ||
Average: | $ 169,386 | $ 105 |
Operating Analysis
Annual Property Operating Data
Incomes | % of GOI | |
---|---|---|
Gross Scheduled Income
Gross Scheduled Income (GSI)
Represents the total of monthly rents for the particular property, including the potential rents from vacant units and uncollectable rents.
Gross Scheduled Income (GSI)
Represents the total of monthly rents for the particular property, including the potential rents from vacant units and uncollectable rents.
|
$ 16,800 | |
Total Gross Income | $ 16,800 | |
Vacancy loss
Vacancy and Credit Loss
Part of the potential rental income that is lost because of unoccupied units or uncollectable rent from tenants.
Vacancy and Credit Loss
Part of the potential rental income that is lost because of unoccupied units or uncollectable rent from tenants.
|
$ 672 | |
Gross Operating Income
Gross Operating Income (GOI)
An actual income which is expected to be collected in the property.
Gross Operating Income (GOI)
An actual income which is expected to be collected in the property.
|
$ 16,128 | 100.00 % |
Expenses
Operating Expenses
Expenses necessary for maintaining the property and ensuring its continued ability to produce income (doesn't include mortgage payments or depreciation).
Operating Expenses
Expenses necessary for maintaining the property and ensuring its continued ability to produce income (doesn't include mortgage payments or depreciation).
|
||
Property tax | $ 1,247 | 7.73 % |
Total Expenses | $ 2,494 | 15.46 % |
Net Operating Income
Net Operating Income (NOI)
Important measurement calculated as gross operating income minus operating expenses.
Net Operating Income (NOI)
Important measurement calculated as gross operating income minus operating expenses.
|
$ 13,634 | 84.54 % |
Cash Flow (Year 1)
Net Operating Income | $ 13,634 | 84.54 % |
Annual Debt Service | $ 0 | 0.00 % |
Cash Flow Before Taxes (CFBT)
Cash Flow
All the inflows and outflows of cash for a certain property (including mortgage payments). We can calculate cash flow before taxes (CFBT) or cash flow after taxes (CFAT) which is CFBT minus any tax liability arising from the operation of the property.
Cash Flow
All the inflows and outflows of cash for a certain property (including mortgage payments). We can calculate cash flow before taxes (CFBT) or cash flow after taxes (CFAT) which is CFBT minus any tax liability arising from the operation of the property.
|
$ 13,634 | 84.54 % |
Income Tax Liability | $ 2,173 | 13.47 % |
Cash Flow After Taxes (CFAT)
Cash Flow
All the inflows and outflows of cash (including mortgage payments). We can calculate cash flow before taxes (CFBT) or cash flow after taxes (CFAT) which is CFBT minus any tax liability arising from the operation of the property.
Cash Flow
All the inflows and outflows of cash (including mortgage payments). We can calculate cash flow before taxes (CFBT) or cash flow after taxes (CFAT) which is CFBT minus any tax liability arising from the operation of the property.
|
$ 11,461 | 71.06 % |
Operating Ratios
Operating Expense Ratio
Ratio of the operating expenses to the gross operating income (GOI).
Operating Expense Ratio
Ratio of the operating expenses to the gross operating income (GOI).
|
15.46 % |
Break-Even Ratio
Break-Even Ratio (BER)
Another benchmark used by mortgage lenders, estimating how vulnerable is a certain property to defaulting on its mortgage if part of the rental income is declined. Most of the lenders are looking for BER of 85% or less.
Break-Even Ratio (BER)
Another benchmark used by mortgage lenders, estimating how vulnerable is a certain property to defaulting on its mortgage if part of the rental income is declined. Most of the lenders are looking for BER of 85% or less.
|
15.46 % |
Financial Analysis
Financial Measures
Net Present Value
Net Present Value (NPV)
Probably the best measure of any investment thanks to its complexity; taking into account all future cash flows including the selling price, and it converts all these amounts to their present values using discount rate required by the investor. More information and an example on the blog.
|
$ 41,919 |
Internal Rate of Return
Internal Rate of Return (IRR)
Rate which an investment will return over the estimated period of ownership. It is in fact the discount rate that produces NPV of zero.
Internal Rate of Return (IRR)
Rate which an investment will return over the estimated period of ownership. It is in fact the discount rate that produces NPV of zero.
|
8.03 % |
Profitability Index
Profitability Index
Similar to NPV, also calculates with the present values of future cash flows and discount rate. It shows whether the present value of the cash flows is worth the initial investment. Good investment should be above 1.0
Profitability Index
Similar to NPV, also calculates with the present values of future cash flows and discount rate. It shows whether the present value of the cash flows is worth the initial investment. Good investment should be above 1.0
|
1.25 |
Annual Depreciation | $ 4,943 |
Holding period of 10 years and discount rate of 5.00% were used for calculation of NPV and IRR. The rest of the financial measures are for the 1st year only and therefore don't provide such an exact information.
Investment Return Ratios
Cash on Cash Return
Cash on Cash Return
Ratio between annual cash flow before taxes and the total initial investment, expressed as a percentage. It does not take in account the future value of money.
Cash on Cash Return
Ratio between annual cash flow before taxes and the total initial investment, expressed as a percentage. It does not take in account the future value of money.
|
7.99 % |
Return on Investment
Very similar to Cash on Cash Return, but also takes in account appreciation of the property in the first year.
Return on Investment
Very similar to Cash on Cash Return, but also takes in account appreciation of the property in the first year.
|
10.98 % |
Capitalization Rate
Capitalization Rate
Calculated as ratio of the net operating income and the value of the property.
Capitalization Rate
Calculated as ratio of the net operating income and the value of the property.
|
8.02 % |
Gross Rental Yield
Gross Rental Yield
Used for a particular property or also as a market indicator when using median values of rent and house prices - counted from gross scheduled rent and initial investment.
Gross Rental Yield
Used for a particular property or also as a market indicator when using median values of rent and house prices - counted from gross scheduled rent and initial investment.
|
9.89 % |
Gross Rent Multiplier
Gross Rent Multiplier (GRM)
Counted as a ratio of market value of the property and gross scheduled income.
Gross Rent Multiplier (GRM)
Counted as a ratio of market value of the property and gross scheduled income.
|
10.11 |
Long-term Cash Flow Forecast
Year | 0 | 1 | 2 | 3 | 4 | 5 | 6 | 7 | 8 | 9 | 10 |
---|---|---|---|---|---|---|---|---|---|---|---|
Operational Analysis | |||||||||||
Gross Scheduled Income | 0 | 16,800 | 17,136 | 17,479 | 17,828 | 18,185 | 18,549 | 18,920 | 19,298 | 19,684 | 20,078 |
Vacancy Loss | 0 | 672 | 685 | 699 | 713 | 727 | 742 | 757 | 772 | 787 | 803 |
Gross Operating Income | 0 | 16,128 | 16,451 | 16,780 | 17,115 | 17,457 | 17,807 | 18,163 | 18,526 | 18,897 | 19,274 |
Expenses | 0 | 2,494 | 2,544 | 2,595 | 2,647 | 2,700 | 2,754 | 2,809 | 2,865 | 2,922 | 2,981 |
Net Operating Income | 0 | 13,634 | 13,907 | 14,185 | 14,468 | 14,758 | 15,053 | 15,354 | 15,661 | 15,974 | 16,294 |
Cash Flow | |||||||||||
Repairs/Construction | 0 | 0 | 0 | 0 | 0 | 0 | 0 | 0 | 0 | 0 | 0 |
Cash Flow Before Taxes | -170,533 | 13,634 | 13,907 | 14,185 | 14,468 | 14,758 | 15,053 | 15,354 | 15,661 | 15,974 | 16,294 |
Depreciation | 0 | 4,943 | 4,943 | 4,943 | 4,943 | 4,943 | 4,943 | 4,943 | 4,943 | 4,943 | 4,943 |
Taxes | 0 | 2,173 | 2,241 | 2,310 | 2,381 | 2,454 | 2,528 | 2,603 | 2,680 | 2,758 | 2,838 |
Cash Flow After Taxes | -170,533 | 11,461 | 11,666 | 11,874 | 12,087 | 12,304 | 12,526 | 12,751 | 12,982 | 13,217 | 13,456 |
Note: All amounts in the table above are in $
Resale Analysis
Resale Price Evaluation Methods
The property is sold after 10 years. Below is the resale price calculated using different methods.
Gross Rent Multiplier | $ 202,984 |
Appreciation (3.00%) | $ 228,331 |
Cap Rate (8.02%) & NOI | $ 203,165 |
Sale Proceeds
Projected Selling Price | $ 202,984 |
Costs of Sale (6.00%) | $ 12,179 |
Net Sale Proceeds Before Tax | $ 190,805 |
In the resale analysis we do not include any calculation for taxes that might be owed on sale of the property. The tax laws for the resale are rather complex and subjected to frequent changes.
Net Assets and Yield
Net Assets | |
---|---|
Sale Proceeds Before Tax | $ 190,805 |
Investor Cash Outlay | $ 170,533 |
Net Assets | $ 20,272 |
Average Yield | |
Annual Net Assets | $ 2,027 |
Average Cash Flow (After Taxes) | $ 11,087 |
Average Annual Gain (After Taxes) | $ 13,114 |
Average Annual Yield (After Taxes) | 7.72 % |
This charts shows Net Present Value (NPV) when property is sold in various years, i.e. when sold in 5th year, the NPV is calculated from 5 years of Cash Flow (including the selling price) and this NPV is displayed in year 5. Optimal holding period can be estimated, using this method - when NPV is the highest. Please note that appreciation growth can change these numbers greatly. It sometimes makes sense to sell the property even before the end of the mortgage term.
Photos


Sign in to edit this report, add or compare properties. Don't have an acount? Sign up now!
Send PDF report by email
Enter email address and note for the recipient:
Now you can preview or download/share your report.
No results found for this property.