Wambolt & Associates

Littleton, Colorado

Property Report: 1902 N Main Ave, Springfield RENTAL

Property Report :

1902 N Main Ave, Springfield, MO 65803

Created on: Apr 14, 2025

Author: Evan Coats

Company: Wambolt & Associates

1902 N Main Ave, Springfield, MO 65803

Singlefamily: 4 bedrooms , 2 bathrooms

Year built: 1913, Size: 1512 SF

Investment strategy: Rental Property

Purchase Price$ 100,000
Rent$ 1,400/mo
Monthly Cash Flow$ 663
Cash on Cash Return14.21 %

Financial Analysis

Cash on Cash Return 14.21 %
Internal Rate of Return (IRR) 15.00 %
Capitalization Rate 9.80 %
Gross Rent Multiplier (GRM) 7.14
Debt-coverage Ratio (DCR) 3.09
Operating Expense Ratio (OER) 27.81 %
After Repair Value $ 120,000
Profit/Equity From Rehab $ 14,000

Financial Breakdown

Purchase Price $ 100,000
Purchase Costs $ 3,500
Repair/Construction Costs $ 2,500
Total Capital Needed
$ 106,000
Financing $ 50,000
Total Cash Needed
$ 56,000
Cash at Closing
$ 50,000
Cash During Rehab
$ 6,000

Operating Analysis

Rent $ 1,400/mo
Gross Operating Income (GOI) $ 16,296
Total Expenses $ 4,533
Net Operating Income (NOI) $ 11,763
Annual Debt Service $ 3,808
Cash Flow Before Taxes (CFBT) $ 7,955
Income Tax Liability $ 1,400
Cash Flow After Taxes (CFAT) $ 6,555

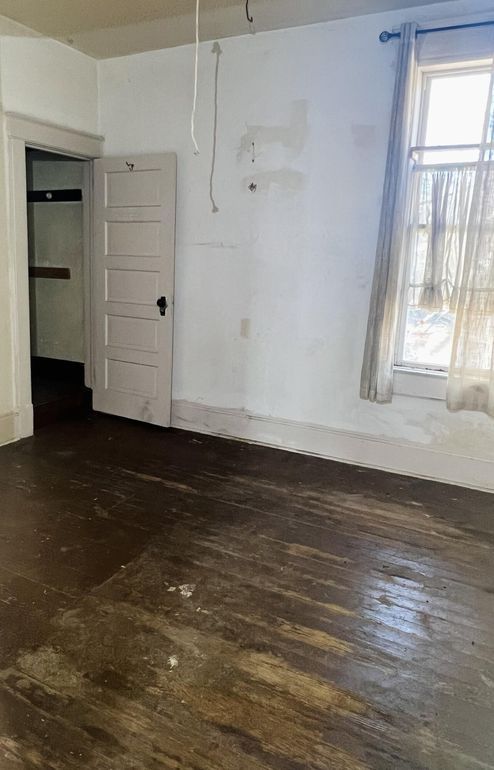
Here is your chance to own an historic Victorian home for a GREAT price! With some TLC, this beauty can come back to life! Perfect home for a flip, or rental! You will find the master on the main floor, 1 full bathroom, family/living room and large kitchen! Upstairs has 1 full bathroom, 2 bedrooms plus 1 nonconforming room that could be turned into another bedroom or an office. Seller will make no repairs.

Purchase Price $ 100,000
Address 1902 N Main Ave , Springfield, 65803, MO
MLS® # 60256339
Listing Agent Ashley Stufflebeam
Year Built 1913
Type Singlefamily
Size 1512 SF
Bedrooms 4
Bathrooms 2

Property History

Date Price Change Event
11/10/2023 100000 Listed
11/22/2021 Listing removed
11/8/2021 140000 Listed
5/18/2014 69900 Listing removed
4/29/2014 69900 Listing removed
1/28/2014 69900 Listed
11/7/2013 72500 Listing removed
3/27/2013 72500 Listed
12/17/2012 75000 Listing removed
8/24/2012 75000 Price Changed
7/22/2012 82500 Listed
12/23/2011 79900 Listing removed
11/2/2011 79900 Price Changed
10/2/2011 85000 Listed
8/31/1999 Sold

Annual Property Operating Data

Incomes % of GOI
Gross Scheduled Income
$ 16,800    
Total Gross Income $ 16,800  
Vacancy loss
$ 504  
Gross Operating Income
$ 16,296 100.00 %
Expenses
Property manager $ 1,304 8.00 %
Utilities $ 1,440 8.84 %
Insurance $ 1,000 6.14 %
Repairs $ 163 1.00 %
Property tax $ 626 3.84 %
Total Expenses $ 4,533 27.81 %
Net Operating Income
$ 11,763 72.19 %
JavaScript chart by amCharts 3.20.13

Cash Flow (Year 1)

Net Operating Income $ 11,763 72.19 %
Annual Debt Service $ 3,808 23.37 %
Cash Flow Before Taxes (CFBT)
$ 7,955 48.82 %
Income Tax Liability $ 1,400 8.59 %
Cash Flow After Taxes (CFAT)
$ 6,555 40.22 %

Operating Ratios

Operating Expense Ratio
27.81 %
Break-Even Ratio
51.18 %

Financial Measures

Net Present Value
$ 126,512
Internal Rate of Return
15.00 %
Profitability Index
3.26
Annual Depreciation $ 2,909

Holding period of 25 years and discount rate of 5.00% were used for calculation of NPV and IRR. The rest of the financial measures are for the 1st year only and therefore don't provide such an exact information.

Investment Return Ratios

Cash on Cash Return
14.21 %
Return on Investment
19.56 %
Capitalization Rate
9.80 %
Gross Rental Yield
16.80 %
Gross Rent Multiplier
7.14
Financing % of ARV
Down Payment $ 50,000 41.67 %
50% down $ 50,000 41.67 %
Loan to Value Ratio
50.00 %
Loan to Cost Ratio
48.78 %
Debt Coverage Ratio 3.09
50% down

Financing of: Purchase price ($ 100,000)

Type Amortized
Loan Amount $ 50,000
Down payment (50%) $ 50,000
Amortization 30 years
Interest Rate 6.54 %
Monthly Payment $ 317.35
JavaScript chart by amCharts 3.20.13

This chart shows the process of accumulation of investor's equity. There is some equity created right at the beginning with the rehab/construction and later investor's equity is rising by paying off the principal of the loan and also by appreciation over the years. All the green parts is the cummulative equity belonging to the investor and the red part belongs to the lender.

Year 012345678910111213141516171819202122232425
Operational Analysis
Gross Scheduled Income 0 16,800 17,136 17,479 17,828 18,185 18,549 18,920 19,298 19,684 20,078 20,479 20,889 21,306 21,733 22,167 22,611 23,063 23,524 23,995 24,474 24,964 25,463 25,972 26,492 27,022
Vacancy Loss 0 504 514 524 535 546 556 568 579 591 602 614 627 639 652 665 678 692 706 720 734 749 764 779 795 811
Gross Operating Income 0 16,296 16,622 16,954 17,293 17,639 17,992 18,352 18,719 19,093 19,475 19,865 20,262 20,667 21,081 21,502 21,932 22,371 22,818 23,275 23,740 24,215 24,699 25,193 25,697 26,211
Expenses 0 4,533 4,623 4,716 4,810 4,906 5,004 5,105 5,207 5,311 5,417 5,525 5,636 5,749 5,863 5,981 6,100 6,222 6,347 6,474 6,603 6,735 6,870 7,007 7,148 7,291
Net Operating Income 0 11,763 11,999 12,239 12,483 12,733 12,988 13,247 13,512 13,783 14,058 14,339 14,626 14,919 15,217 15,521 15,832 16,149 16,472 16,801 17,137 17,480 17,829 18,186 18,550 18,921
Loan Payment 0 3,808 3,808 3,808 3,808 3,808 3,808 3,808 3,808 3,808 3,808 3,808 3,808 3,808 3,808 3,808 3,808 3,808 3,808 3,808 3,808 3,808 3,808 3,808 3,808 3,808
Payment Interest Part 0 3,254 3,216 3,176 3,134 3,088 3,040 2,988 2,933 2,874 2,811 2,743 2,672 2,595 2,513 2,426 2,333 2,233 2,127 2,014 1,893 1,764 1,626 1,479 1,322 1,155
Payment Principal Part 0 555 592 632 675 720 768 820 876 935 998 1,065 1,137 1,213 1,295 1,382 1,475 1,575 1,681 1,794 1,915 2,044 2,182 2,329 2,486 2,654
Cash Flow
Repairs/Construction 2,500 0 0 0 0 0 0 0 0 0 0 0 0 0 0 0 0 0 0 0 0 0 0 0 0 0
Cash Flow Before Taxes -56,000 7,955 8,190 8,430 8,675 8,925 9,179 9,439 9,704 9,974 10,250 10,531 10,818 11,111 11,409 11,713 12,024 12,340 12,663 12,993 13,329 13,671 14,021 14,378 14,741 15,112
Depreciation 0 2,909 2,909 2,909 2,909 2,909 2,909 2,909 2,909 2,909 2,909 2,909 2,909 2,909 2,909 2,909 2,909 2,909 2,909 2,909 2,909 2,909 2,909 2,909 2,909 2,909
Taxes 0 1,400 1,468 1,538 1,610 1,684 1,760 1,838 1,918 2,000 2,085 2,172 2,261 2,354 2,449 2,547 2,648 2,752 2,859 2,969 3,084 3,202 3,324 3,449 3,580 3,714
Cash Flow After Taxes -56,000 6,555 6,722 6,892 7,065 7,241 7,420 7,602 7,786 7,974 8,165 8,359 8,557 8,757 8,960 9,167 9,376 9,589 9,805 10,023 10,245 10,470 10,698 10,928 11,162 11,398

Note: All amounts in the table above are in $

JavaScript chart by amCharts 3.20.13

Resale Price Evaluation Methods

The property is sold after 25 years. Below is the resale price calculated using different methods.

Appreciation (3.00%) $ 251,253
Cap Rate (9.80%) & NOI $ 193,067
Gross Rent Multiplier $ 192,935

Sale Proceeds

Projected Selling Price $ 251,253
Costs of Sale (6.00%) $ 15,075
1. Loan Balance Payoff $ 16,204
Net Sale Proceeds Before Tax $ 219,974

In the resale analysis we do not include any calculation for taxes that might be owed on sale of the property. The tax laws for the resale are rather complex and subjected to frequent changes.

Net Assets and Yield

Net Assets
Sale Proceeds Before Tax $ 219,974
Investor Cash Outlay $ 56,000
Net Assets $ 163,974
Average Yield
Annual Net Assets $ 6,559
Average Cash Flow (After Taxes) $ 8,381
Average Annual Gain (After Taxes) $ 14,940
Average Annual Yield (After Taxes) 14.94 %
JavaScript chart by amCharts 3.20.13

This charts shows Net Present Value (NPV) when property is sold in various years, i.e. when sold in 5th year, the NPV is calculated from 5 years of Cash Flow (including the selling price) and this NPV is displayed in year 5. Optimal holding period can be estimated, using this method - when NPV is the highest. Please note that appreciation growth can change these numbers greatly. It sometimes makes sense to sell the property even before the end of the mortgage term.

Sign in to edit this report, add or compare properties. Don't have an acount? Sign up now!

BESbswy