{{ label }}


Real Estate Analysis


Property Report: 1857 E American Way Unit 14, Eagle Mountain RENTAL
Property Report :
1857 E American Way Unit 14, Eagle Mountain, UT 84005
Powered by
Real Estate Analysis
Created on: Apr 14, 2025
Author: Abby Brant & Brenda Horrocks
Executive Summary
1857 E American Way Unit 14, Eagle Mountain, UT 84005
Singlefamily: 3 bedrooms , 2 bathrooms
Year built: 2018, Size: 1806 SF
Investment strategy: Rental Property
72 Hour Sale! Starts this Saturday June 25 with an Open House from noon until 2pm. Awesome house priced to sell this weekend! Sellers have loved this house and the community but the time has come and they need to move. Park like front yard with playgrounds all around and wide open spaces. Beautiful views from the front porch. Come see me on Saturday from 12:00 to 2:00 pm.
Purchase Price$ 420,000
Rent$ 2,095/mo
Monthly Cash Flow$ 475
Cash on Cash Return2.31 %
Financial Analysis
| Cash on Cash Return | 2.31 % |
| Internal Rate of Return (IRR) | 6.92 % |
| Capitalization Rate | 4.41 % |
| Gross Rent Multiplier (GRM) | 16.71 |
| Debt-coverage Ratio (DCR) | 1.44 |
| Operating Expense Ratio (OER) | 25.66 % |
Financial Breakdown
| Purchase Price | $ 420,000 |
| Purchase Costs | $ 4,200 |
| Repair/Construction Costs | $ 0 |
| $ 424,200 | |
| Financing | $ 178,000 |
| $ 246,200 | |
| $ 0 | |
| $ 246,200 |
Operating Analysis
| Rent | $ 2,095/mo |
| Gross Operating Income (GOI) | $ 24,889 |
| Total Expenses | $ 6,388 |
| Net Operating Income (NOI) | $ 18,501 |
| Annual Debt Service | $ 12,806 |
| Cash Flow Before Taxes (CFBT) | $ 5,694 |
| Income Tax Liability | $ -1,084 |
| Cash Flow After Taxes (CFAT) | $ 6,779 |
Property Description
| Purchase Price | $ 420,000 |
| Address | 1857 E American Way Unit 14 , Eagle Mountain, 84005, UT |
| MLS® # | 1820905 |
| Listing Agent | Steve Judkins |
| Listing Broker | Kw South Valley Keller Williams |
| Year Built | 2018 |
| Type | Singlefamily |
| Size | 1806 SF |
| Bedrooms | 3 |
| Bathrooms | 2 |
Operating Analysis
Financial Analysis
Financing Overview
Long-term Cash Flow Forecast
Resale Analysis
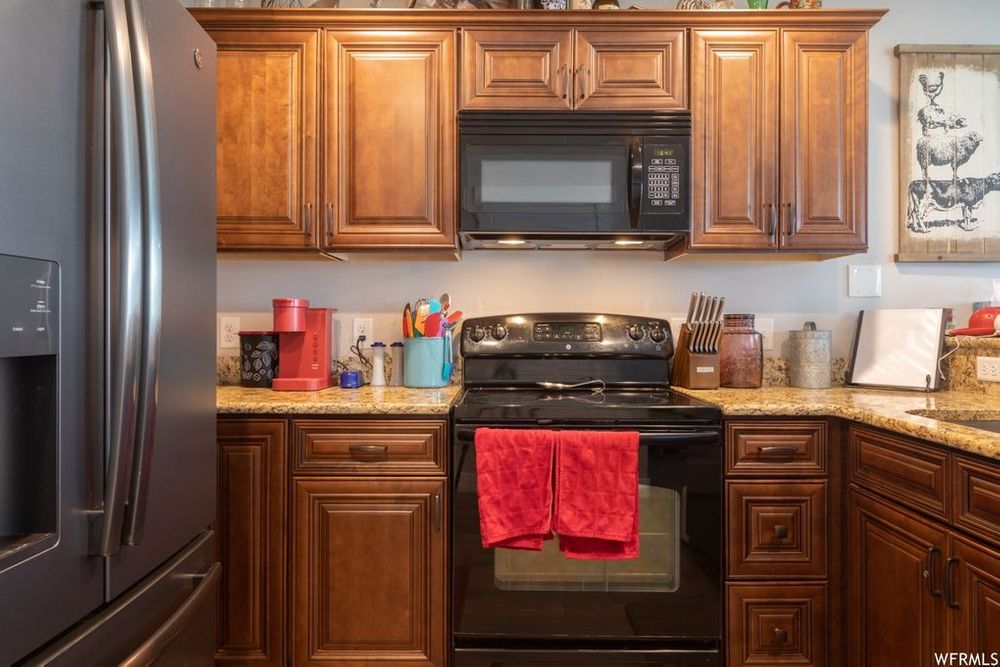
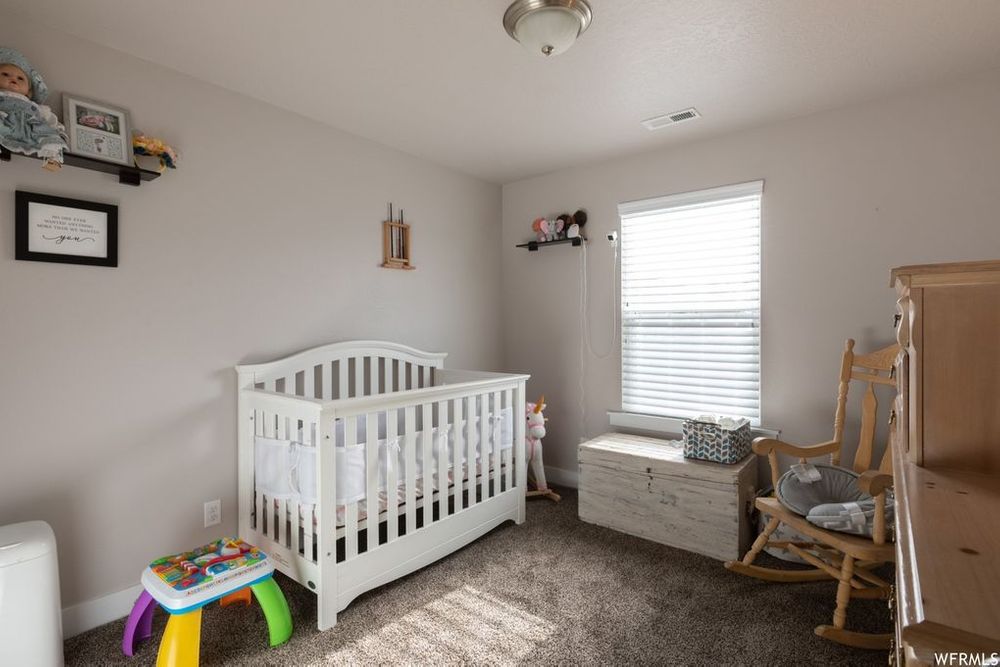
Photos
Sign in to edit this report, add or compare properties. Don't have an acount? Sign up now!