Property Report: 182 E Aparicio Dr N, Tooele RENTAL

Property Report :

182 E Aparicio Dr N, Tooele, UT 84074

Created on: Apr 15, 2025

Author: Abby Brant & Brenda Horrocks

182 E Aparicio Dr N, Tooele, UT 84074

Singlefamily: 4 bedrooms , 2.5 bathrooms

Year built: 1999, Size: 2540 SF

Investment strategy: Rental Property

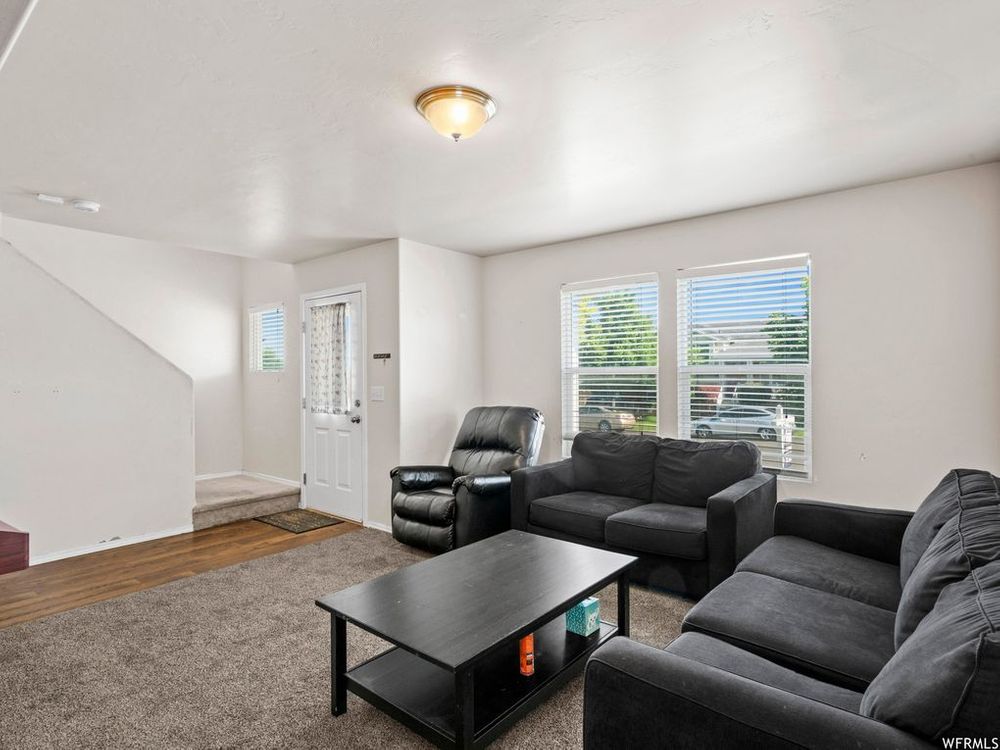
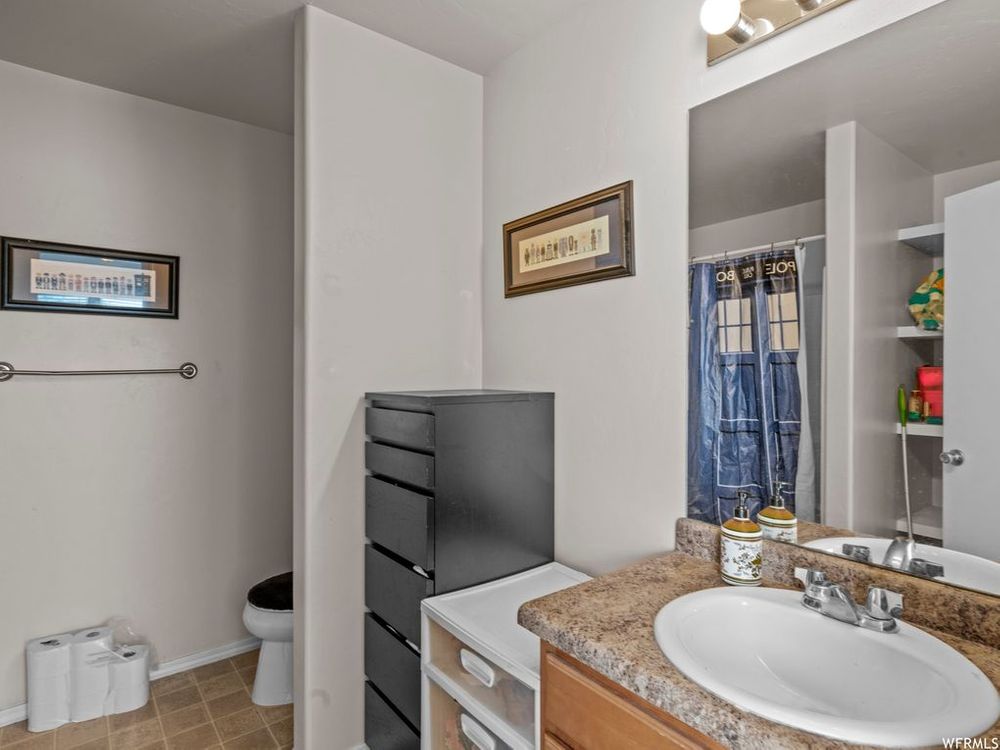
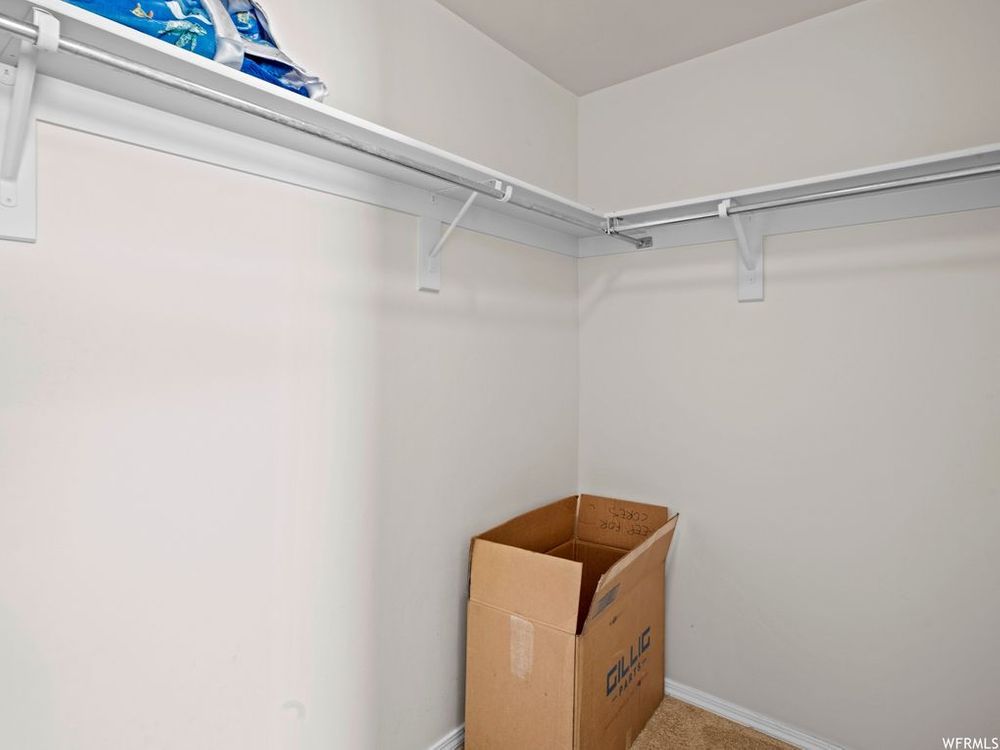
Don't miss out on this adorable 4 bedroom 2 1/2 bathroom two story!! This great move-in-ready home will not disappoint! Great loft area upstairs with master suite and additional 3 bedrooms Basement is 50% finished as a theater room, Room for storage & bath in the rest. Priced to sale with over 2500 square ft!! See 3D Tour below. Square footage figures are provided as a courtesy estimate only and were obtained from county . Buyer is advised to obtain an independent measurement.

Purchase Price$ 449,888
Rent$ 2,250/mo
Monthly Cash Flow$ 459
Cash on Cash Return2.40 %

Financial Analysis

Cash on Cash Return 2.40 %
Internal Rate of Return (IRR) 7.53 %
Capitalization Rate 4.82 %
Gross Rent Multiplier (GRM) 16.66
Debt-coverage Ratio (DCR) 1.34
Operating Expense Ratio (OER) 18.86 %

Financial Breakdown

Purchase Price $ 449,888
Purchase Costs $ 4,500
Repair/Construction Costs $ 0
Total Capital Needed
$ 454,388
Financing $ 224,944
Total Cash Needed
$ 229,444
Cash at Closing
$ 224,944
Cash During Rehab
$ 4,500

Operating Analysis

Rent $ 2,250/mo
Gross Operating Income (GOI) $ 26,730
Total Expenses $ 5,041
Net Operating Income (NOI) $ 21,689
Annual Debt Service $ 16,184
Cash Flow Before Taxes (CFBT) $ 5,505
Income Tax Liability $ -1,205
Cash Flow After Taxes (CFAT) $ 6,710
Purchase Price $ 449,888
Address 182 E Aparicio Dr N , Tooele, 84074, UT
MLS® # 1824470
Listing Agent Shane Hughes
Listing Broker Abundance Realty Group
Year Built 1999
Type Singlefamily
Size 2540 SF
Bedrooms 4
Bathrooms 2.5

Annual Property Operating Data

Incomes % of GOI
Gross Scheduled Income
$ 27,000    
Total Gross Income $ 27,000  
Vacancy loss
$ 270  
Gross Operating Income
$ 26,730 100.00 %
Expenses
Property manager $ 2,379 8.90 %
Repairs $ 802 3.00 %
Association fees $ 960 3.59 %
Insurance $ 900 3.37 %
Total Expenses $ 5,041 18.86 %
Net Operating Income
$ 21,689 81.14 %
JavaScript chart by amCharts 3.20.13
JavaScript chart by amCharts 3.20.13CFBT Loan paymentProperty managerRepairsAssociation feesInsurance

Cash Flow (Year 1)

Net Operating Income $ 21,689 81.14 %
Annual Debt Service $ 16,184 60.55 %
Cash Flow Before Taxes (CFBT)
$ 5,505 20.60 %
Income Tax Liability $ -1,205 -4.51 %
Cash Flow After Taxes (CFAT)
$ 6,710 25.10 %

Operating Ratios

Operating Expense Ratio
18.86 %
Break-Even Ratio
79.40 %

Financial Measures

Net Present Value
$ 163,475
Internal Rate of Return
7.53 %
Profitability Index
1.71
Annual Depreciation $ 13,088

Holding period of 30 years and discount rate of 5.00% were used for calculation of NPV and IRR. The rest of the financial measures are for the 1st year only and therefore don't provide such an exact information.

Investment Return Ratios

Cash on Cash Return
2.40 %
Return on Investment
8.28 %
Capitalization Rate
4.82 %
Gross Rental Yield
6.00 %
Gross Rent Multiplier
16.66
Financing
Down Payment $ 224,944
conventional $ 224,944
Loan to Value Ratio
50.00 %
Loan to Cost Ratio
50.00 %
Debt Coverage Ratio 1.34
conventional

Financing of: Purchase price ($ 449,888)

Type Amortized
Loan Amount $ 224,944
Down payment (50%) $ 224,944
Amortization 30 years
Interest Rate 6.00 %
Monthly Payment $ 1,348.65
JavaScript chart by amCharts 3.20.13
JavaScript chart by amCharts 3.20.13Down PaymentconventionalCash During Rehab
JavaScript chart by amCharts 3.20.13
JavaScript chart by amCharts 3.20.13Loan Principal Balance Equity: Principal Paid Equity: Cash Outlay Equity: Appreciation

This chart shows the process of accumulation of investor's equity. There is some equity created right at the beginning with the rehab/construction and later investor's equity is rising by paying off the principal of the loan and also by appreciation over the years. All the green parts is the cummulative equity belonging to the investor and the red part belongs to the lender.

Year 0123456789101112131415161718192021222324252627282930
Operational Analysis
Gross Scheduled Income 0 27,000 27,540 28,091 28,653 29,226 29,810 30,406 31,015 31,635 32,268 32,913 33,571 34,243 34,927 35,626 36,338 37,065 37,807 38,563 39,334 40,121 40,923 41,741 42,576 43,428 44,296 45,182 46,086 47,008 47,948
Vacancy Loss 0 270 275 281 287 292 298 304 310 316 323 329 336 342 349 356 363 371 378 386 393 401 409 417 426 434 443 452 461 470 479
Gross Operating Income 0 26,730 27,265 27,810 28,366 28,933 29,512 30,102 30,704 31,318 31,945 32,584 33,235 33,900 34,578 35,270 35,975 36,695 37,428 38,177 38,941 39,719 40,514 41,324 42,151 42,994 43,853 44,730 45,625 46,538 47,468
Expenses 0 5,041 5,142 5,245 5,349 5,456 5,566 5,677 5,790 5,906 6,024 6,145 6,268 6,393 6,521 6,651 6,784 6,920 7,058 7,200 7,344 7,490 7,640 7,793 7,949 8,108 8,270 8,436 8,604 8,776 8,952
Net Operating Income 0 21,689 22,123 22,565 23,017 23,477 23,947 24,425 24,914 25,412 25,921 26,439 26,968 27,507 28,057 28,618 29,191 29,775 30,370 30,977 31,597 32,229 32,873 33,531 34,202 34,886 35,583 36,295 37,021 37,761 38,517
Loan Payment 0 16,184 16,184 16,184 16,184 16,184 16,184 16,184 16,184 16,184 16,184 16,184 16,184 16,184 16,184 16,184 16,184 16,184 16,184 16,184 16,184 16,184 16,184 16,184 16,184 16,184 16,184 16,184 16,184 16,184 16,184
Payment Interest Part 0 13,421 13,251 13,070 12,878 12,674 12,458 12,228 11,984 11,725 11,450 11,158 10,848 10,519 10,170 9,799 9,405 8,987 8,543 8,071 7,571 7,040 6,476 5,877 5,242 4,567 3,850 3,089 2,282 1,424 514
Payment Principal Part 0 2,762 2,933 3,114 3,306 3,510 3,726 3,956 4,200 4,459 4,734 5,026 5,336 5,665 6,014 6,385 6,779 7,197 7,641 8,112 8,613 9,144 9,708 10,307 10,942 11,617 12,334 13,094 13,902 14,760 15,670
Cash Flow
Repairs/Construction 0 0 0 0 0 0 0 0 0 0 0 0 0 0 0 0 0 0 0 0 0 0 0 0 0 0 0 0 0 0 0
Cash Flow Before Taxes -229,444 5,505 5,939 6,382 6,833 7,293 7,763 8,242 8,730 9,228 9,737 10,255 10,784 11,323 11,873 12,435 13,007 13,591 14,186 14,794 15,413 16,045 16,690 17,347 18,018 18,702 19,399 20,111 20,837 21,577 22,333
Depreciation 0 13,088 13,088 13,088 13,088 13,088 13,088 13,088 13,088 13,088 13,088 13,088 13,088 13,088 13,088 13,088 13,088 13,088 13,088 13,088 13,088 13,088 13,088 13,088 13,088 13,088 13,088 13,088 13,088 13,088 13,088
Taxes 0 -1,205 -1,054 -898 -737 -571 -400 -223 -40 150 346 548 758 975 1,200 1,433 1,674 1,925 2,185 2,454 2,734 3,025 3,327 3,641 3,968 4,308 4,661 5,029 5,413 5,812 6,229
Cash Flow After Taxes -229,444 6,710 6,993 7,280 7,570 7,865 8,163 8,464 8,770 9,079 9,391 9,707 10,026 10,348 10,673 11,002 11,332 11,666 12,001 12,339 12,679 13,020 13,362 13,706 14,050 14,394 14,738 15,082 15,424 15,765 16,104

Note: All amounts in the table above are in $

JavaScript chart by amCharts 3.20.13
JavaScript chart by amCharts 3.20.13GOINOICFBTCFAT

Resale Price Evaluation Methods

The property is sold after 30 years. Below is the resale price calculated using different methods.

Appreciation (3.00%) $ 1,091,996
Cap Rate (4.82%) & NOI $ 799,098
Gross Rent Multiplier $ 798,811

Sale Proceeds

Projected Selling Price $ 1,091,996
Costs of Sale (6.00%) $ 65,520
Net Sale Proceeds Before Tax $ 1,026,476

In the resale analysis we do not include any calculation for taxes that might be owed on sale of the property. The tax laws for the resale are rather complex and subjected to frequent changes.

Net Assets and Yield

Net Assets
Sale Proceeds Before Tax $ 1,026,476
Investor Cash Outlay $ 229,444
Net Assets $ 797,032
Average Yield
Annual Net Assets $ 26,568
Average Cash Flow (After Taxes) $ 10,720
Average Annual Gain (After Taxes) $ 37,288
Average Annual Yield (After Taxes) 8.29 %
JavaScript chart by amCharts 3.20.13

This charts shows Net Present Value (NPV) when property is sold in various years, i.e. when sold in 5th year, the NPV is calculated from 5 years of Cash Flow (including the selling price) and this NPV is displayed in year 5. Optimal holding period can be estimated, using this method - when NPV is the highest. Please note that appreciation growth can change these numbers greatly. It sometimes makes sense to sell the property even before the end of the mortgage term.

Sign in to edit this report, add or compare properties. Don't have an acount? Sign up now!

BESbswy