Property Report: 174 Harris St, Grantsville RENTAL
Property Report :
174 Harris St, Grantsville, UT 84029

Powered by
Real Estate Analysis
Created on: Apr 16, 2025
Author: Abby Brant & Brenda Horrocks
Executive Summary
174 Harris St, Grantsville, UT 84029
Singlefamily: 4 bedrooms , 1.5 bathrooms
Year built: 1965, Size: 2184 SF
Investment strategy: Rental Property
PRICE REDUCTION! This home has many wonderful new additions! They've completed a garage, updated the flooring, and opened the floor plan to make a Great room. The beautifully remodeled kitchen has NEW appliances, counter tops, cabinets and breakfast nook. They updated the bathroom vanity to match the kitchen so the home is aesthetically pleasing. New electric panel and fiber internet is also a great bonus! This home is walking distance to churches, parks, schools and grocery stores. If you need to commute into town, the bus route goes right into Salt Lake City. Enjoy living in a charming home & lovely neighborhood!

Financial Analysis
| Cash on Cash Return | 1.96 % |
| Internal Rate of Return (IRR) | 7.30 % |
| Capitalization Rate | 4.60 % |
| Gross Rent Multiplier (GRM) | 16.62 |
| Debt-coverage Ratio (DCR) | 1.28 |
| Operating Expense Ratio (OER) | 22.83 % |
Financial Breakdown
| Purchase Price | $ 389,000 |
| Purchase Costs | $ 3,800 |
| Repair/Construction Costs | $ 0 |
| $ 392,800 | |
| Financing | $ 194,500 |
| $ 198,300 | |
| $ 194,500 | |
| $ 3,800 |
Operating Analysis
| Rent | $ 1,951/mo |
| Gross Operating Income (GOI) | $ 23,178 |
| Total Expenses | $ 5,292 |
| Net Operating Income (NOI) | $ 17,886 |
| Annual Debt Service | $ 13,994 |
| Cash Flow Before Taxes (CFBT) | $ 3,892 |
| Income Tax Liability | $ -1,259 |
| Cash Flow After Taxes (CFAT) | $ 5,151 |
Operating Analysis
Financial Analysis
Financing Overview
Long-term Cash Flow Forecast
Resale Analysis
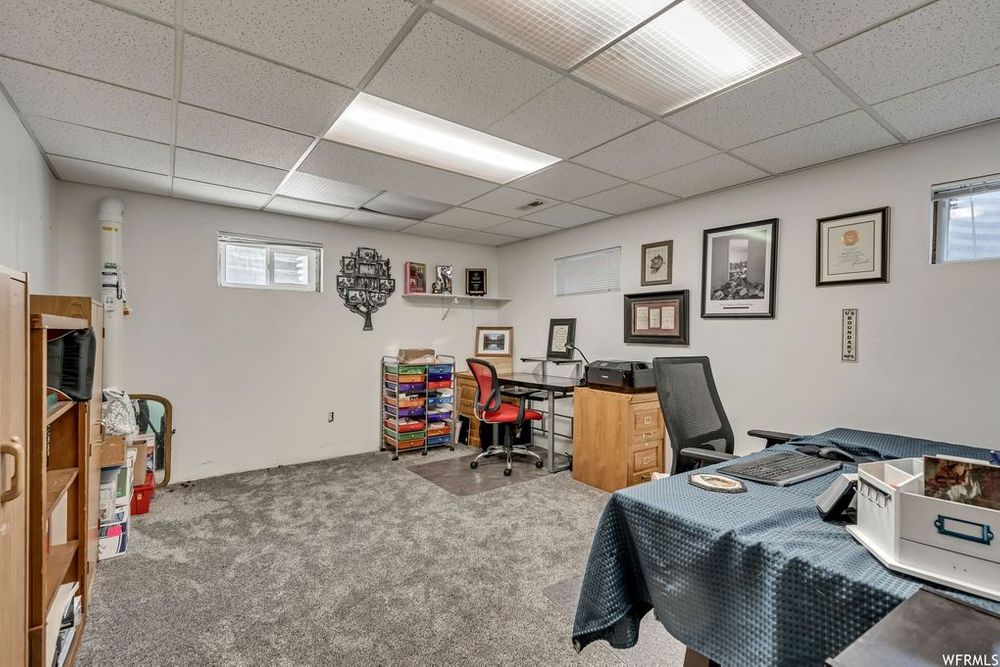
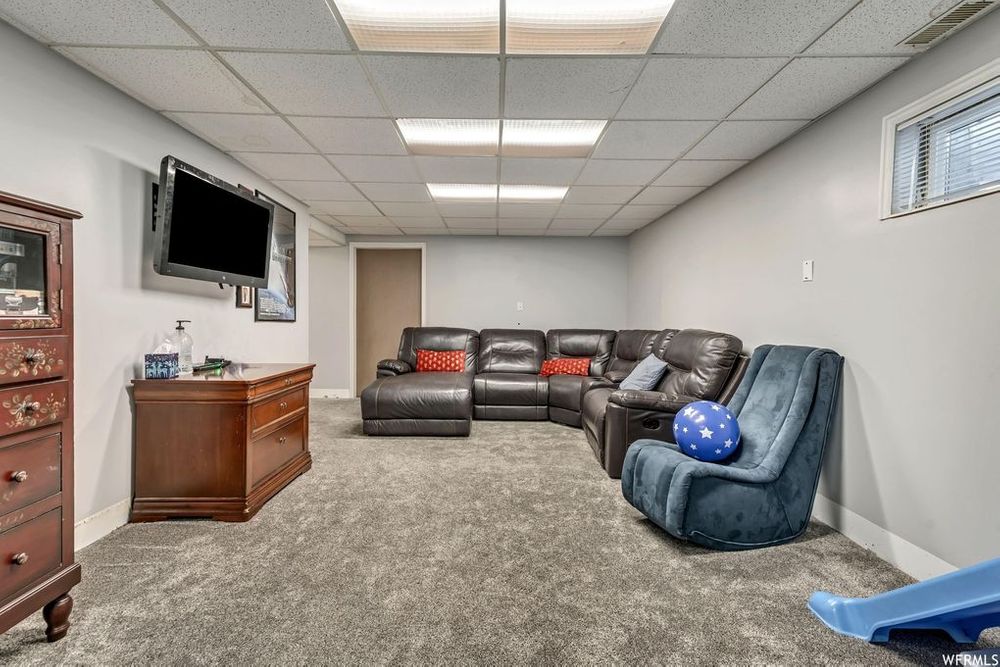
Photos


Sign in to edit this report, add or compare properties. Don't have an acount? Sign up now!