Property Report: Ramona Ave - Market rents RENTAL
Property Report :
Ramona Ave - Market rents
1719 E RAMONA AVE S, Salt Lake City, UT 84108

Powered by
Real Estate Analysis
Created on: Apr 14, 2025
Author: Abby Brant & Brenda Horrocks
Executive Summary
1719 E RAMONA AVE S, Salt Lake City, UT 84108
Multifamily: 6 bedrooms
Year built: 1951, Size: 3440 SF
Investment strategy: Rental Property
Great opportunity for Investors! You will not want to miss this fantastic opportunity!!! Located in the heart of Sugarhouse, this beautiful side by side duplex is only minutes from the University of Utah and Westminster. This rare find has recently had the original hardwood floors beautifully refinished, updated kitchens & baths, new paint, updated furnaces and on-demand water heaters. Each unit has its own washer/dryer hookups. Large yard with mature trees, and a detached 2 car garage. Plenty of square footage to customize for high rentability. - This Duplex is well built - new main water line to each unit with separate shut-off valves, updated pex water lines (each unit). - Square footage figures are provided as a courtesy estimate only. Buyer & Buyer's representative are advised to obtain an independent measurement. Seller is a licensed agent. Also listed under Residential MLS # .

Financial Analysis
| Cash on Cash Return | 3.42 % |
| Internal Rate of Return (IRR) | 8.10 % |
| Capitalization Rate | 5.34 % |
| Gross Rent Multiplier (GRM) | 15.45 |
| Debt-coverage Ratio (DCR) | 1.48 |
| Operating Expense Ratio (OER) | 16.76 % |
Financial Breakdown
| Purchase Price | $ 999,000 |
| Purchase Costs | $ 9,000 |
| Repair/Construction Costs | $ 0 |
| $ 1,008,000 | |
| Financing | $ 499,500 |
| $ 508,500 | |
| $ 499,500 | |
| $ 9,000 |
Operating Analysis
| Rent | $ 5,390/mo |
| Gross Operating Income (GOI) | $ 64,033 |
| Total Expenses | $ 10,730 |
| Net Operating Income (NOI) | $ 53,303 |
| Annual Debt Service | $ 35,937 |
| Cash Flow Before Taxes (CFBT) | $ 17,366 |
| Income Tax Liability | $ -1,390 |
| Cash Flow After Taxes (CFAT) | $ 18,757 |
Operating Analysis
Financial Analysis
Financing Overview
Long-term Cash Flow Forecast
Resale Analysis
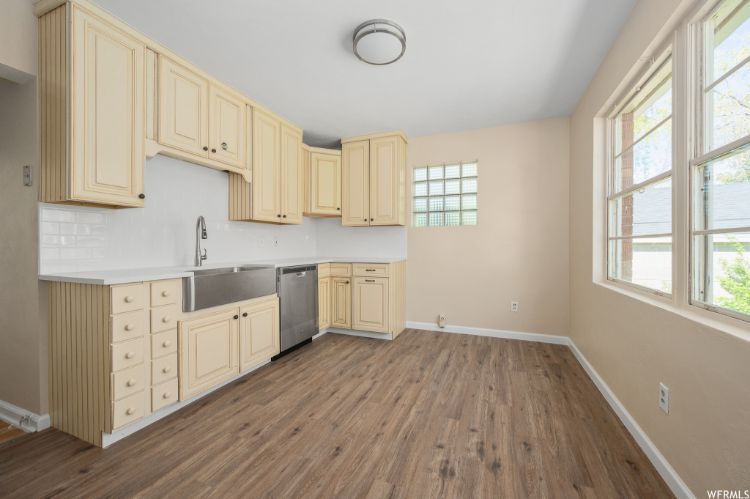
Photos


Sign in to edit this report, add or compare properties. Don't have an acount? Sign up now!