Property Report: 1695 W 42nd St , Hialeah RENTAL

Property Report :

1695 W 42nd St Apt 201, Hialeah, FL 33012

Created on: Apr 15, 2025

Author: Soraya Cedillo

1695 W 42nd St Apt 201, Hialeah, FL 33012

condos: 2 bedrooms , 2 bathrooms

Year built: 1984, Size: 836 SF

Investment strategy: Rental Property

Purchase Price$ 265,000
Rent$ 2,200/mo
Monthly Cash Flow$ 1,042
Cash on Cash Return4.66 %

Financial Analysis

Cash on Cash Return 4.66 %
Internal Rate of Return (IRR) 5.71 %
Capitalization Rate 4.72 %
Gross Rent Multiplier (GRM) 10.04
Debt-coverage Ratio (DCR) 0.00
Operating Expense Ratio (OER) 52.62 %

Financial Breakdown

Purchase Price $ 265,000
Purchase Costs $ 3,321
Repair/Construction Costs $ 0
Total Capital Needed
$ 268,321
Financing $ 0
Total Cash Needed
$ 268,321
Cash at Closing
$ 0
Cash During Rehab
$ 268,321

Operating Analysis

Rent $ 2,200/mo
Gross Operating Income (GOI) $ 26,400
Total Expenses $ 13,892
Net Operating Income (NOI) $ 12,508
Annual Debt Service $ 0
Cash Flow Before Taxes (CFBT) $ 12,508
Income Tax Liability $ 1,200
Cash Flow After Taxes (CFAT) $ 11,308

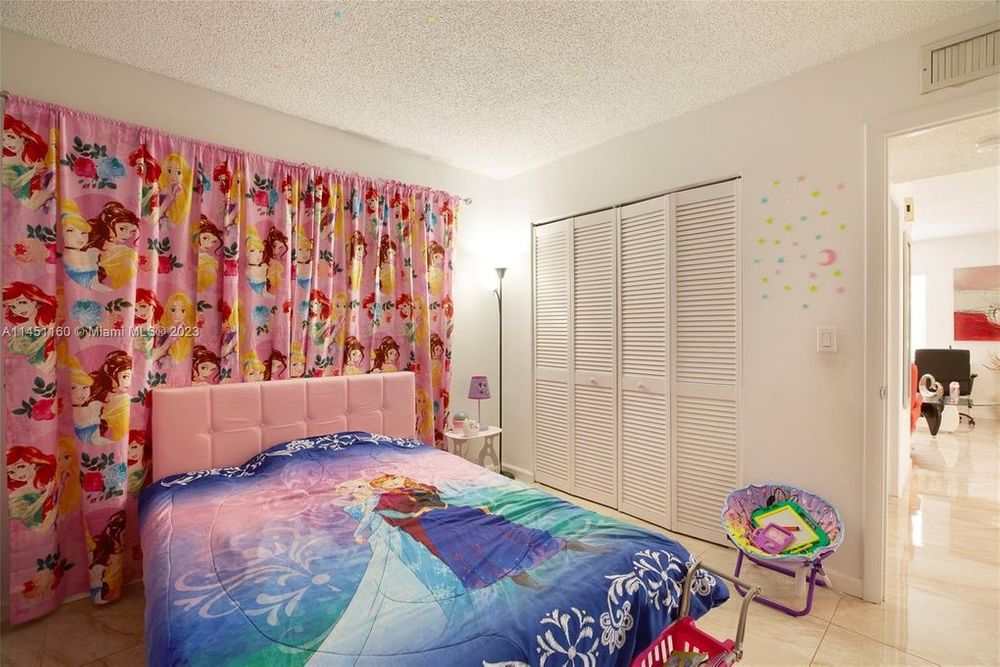
Beautiful and spacious remodeled 2 bedrooms, 2 bathrooms Condo. Tile floors, updated kitchen and appliances. Big balcony. 1 assigned parking space, and guest parking available. Close to 826- Expressway, Shopping center, and Palmetto Hospital. Don't miss this great opportunity!

Purchase Price $ 265,000
Address 1695 W 42nd St Apt 201, Hialeah, 33012, FL
MLS® # A11451160
Listing Agent Barbara Cruzado
Year Built 1984
Type condos
Size 836 SF
Bedrooms 2
Bathrooms 2

Property History

Date Price Change Event
9/11/2023 265000 Listed
11/20/2011 140000 Sold
12/25/2006 142900 Sold

Annual Property Operating Data

Incomes % of GOI
Gross Scheduled Income
$ 26,400    
Total Gross Income $ 26,400  
Vacancy loss
$ 0  
Gross Operating Income
$ 26,400 100.00 %
Expenses
Property manager $ 2,640 10.00 %
Property tax $ 2,324 8.80 %
Association fees $ 8,928 33.82 %
Total Expenses $ 13,892 52.62 %
Net Operating Income
$ 12,508 47.38 %
JavaScript chart by amCharts 3.20.13
JavaScript chart by amCharts 3.20.13CFBTProperty managerProperty taxAssociation fees

Cash Flow (Year 1)

Net Operating Income $ 12,508 47.38 %
Annual Debt Service $ 0 0.00 %
Cash Flow Before Taxes (CFBT)
$ 12,508 47.38 %
Income Tax Liability $ 1,200 4.54 %
Cash Flow After Taxes (CFAT)
$ 11,308 42.83 %

Operating Ratios

Operating Expense Ratio
52.62 %
Break-Even Ratio
52.62 %

Financial Measures

Net Present Value
$ 8,477
Internal Rate of Return
5.71 %
Profitability Index
1.03
Annual Depreciation $ 7,709

Holding period of 5 years and discount rate of 5.00% were used for calculation of NPV and IRR. The rest of the financial measures are for the 1st year only and therefore don't provide such an exact information.

Investment Return Ratios

Cash on Cash Return
4.66 %
Return on Investment
7.62 %
Capitalization Rate
4.72 %
Gross Rental Yield
9.96 %
Gross Rent Multiplier
10.04

There is no financing selected in this deal.

JavaScript chart by amCharts 3.20.13

This chart shows the process of accumulation of investor's equity. There is some equity created right at the beginning with the rehab/construction and later investor's equity is rising by paying off the principal of the loan and also by appreciation over the years. All the green parts is the cummulative equity belonging to the investor and the red part belongs to the lender.

Year 012345
Operational Analysis
Gross Scheduled Income 0 26,400 26,928 27,467 28,016 28,576
Vacancy Loss 0 0 0 0 0 0
Gross Operating Income 0 26,400 26,928 27,467 28,016 28,576
Expenses 0 13,892 14,170 14,453 14,742 15,037
Net Operating Income 0 12,508 12,758 13,013 13,274 13,539
Cash Flow
Repairs/Construction 0 0 0 0 0 0
Cash Flow Before Taxes -268,321 12,508 12,758 13,013 13,274 13,539
Depreciation 0 7,709 7,709 7,709 7,709 7,709
Taxes 0 1,200 1,262 1,326 1,391 1,458
Cash Flow After Taxes -268,321 11,308 11,496 11,687 11,882 12,082

Note: All amounts in the table above are in $

JavaScript chart by amCharts 3.20.13
JavaScript chart by amCharts 3.20.13GOINOICFBTCFAT

Resale Price Evaluation Methods

The property is sold after 5 years. Below is the resale price calculated using different methods.

Appreciation (3.00%) $ 307,208
Cap Rate (4.72%) & NOI $ 286,844
Gross Rent Multiplier $ 286,905

Sale Proceeds

Projected Selling Price $ 307,208
Costs of Sale (6.00%) $ 18,432
Net Sale Proceeds Before Tax $ 288,776

In the resale analysis we do not include any calculation for taxes that might be owed on sale of the property. The tax laws for the resale are rather complex and subjected to frequent changes.

Net Assets and Yield

Net Assets
Sale Proceeds Before Tax $ 288,776
Investor Cash Outlay $ 268,321
Net Assets $ 20,455
Average Yield
Annual Net Assets $ 4,091
Average Cash Flow (After Taxes) $ 9,275
Average Annual Gain (After Taxes) $ 13,366
Average Annual Yield (After Taxes) 5.04 %
JavaScript chart by amCharts 3.20.13

This charts shows Net Present Value (NPV) when property is sold in various years, i.e. when sold in 5th year, the NPV is calculated from 5 years of Cash Flow (including the selling price) and this NPV is displayed in year 5. Optimal holding period can be estimated, using this method - when NPV is the highest. Please note that appreciation growth can change these numbers greatly. It sometimes makes sense to sell the property even before the end of the mortgage term.

Sign in to edit this report, add or compare properties. Don't have an acount? Sign up now!

BESbswy