Property Report: 15624 Lawndale Ave, Markham RENTAL
Property Report :
15624 Lawndale Ave, Markham, IL 60428

Powered by
Real Estate Analysis
![]()
Created on: Apr 14, 2025
Author: Christian Chase
Company: Chase Real Estate - ChaseForeclosure.com
Executive Summary
15624 Lawndale Ave, Markham, IL 60428
Singlefamily: 3 bedrooms , 1 bathroom
Year built: 1955,
Investment strategy: Rental Property

Financial Analysis
| Cash on Cash Return | 25.21 % |
| Internal Rate of Return (IRR) | 24.11 % |
| Capitalization Rate | 11.39 % |
| Gross Rent Multiplier (GRM) | 6.62 |
| Debt-coverage Ratio (DCR) | 1.90 |
| Operating Expense Ratio (OER) | 22.29 % |
| After Repair Value | $ 199,000 |
| Profit/Equity From Rehab | $ 20,632 |
Financial Breakdown
| Purchase Price | $ 139,900 |
| Purchase Costs | $ 8,468 |
| Repair/Construction Costs | $ 30,000 |
| $ 178,368 | |
| Financing | $ 135,920 |
| $ 42,448 | |
| $ 36,698 | |
| $ 5,750 |
Operating Analysis
| Rent | $ 2,505/mo |
| Gross Operating Income (GOI) | $ 29,158 |
| Total Expenses | $ 6,500 |
| Net Operating Income (NOI) | $ 22,658 |
| Annual Debt Service | $ 11,957 |
| Cash Flow Before Taxes (CFBT) | $ 10,702 |
| Income Tax Liability | $ 1,942 |
| Cash Flow After Taxes (CFAT) | $ 8,759 |
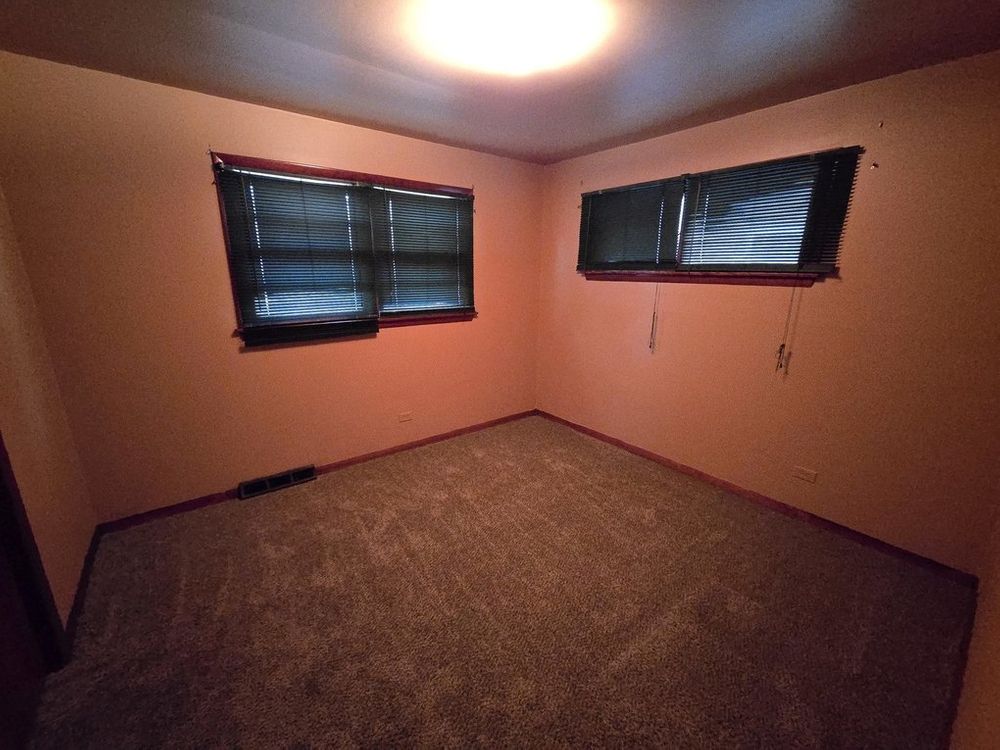
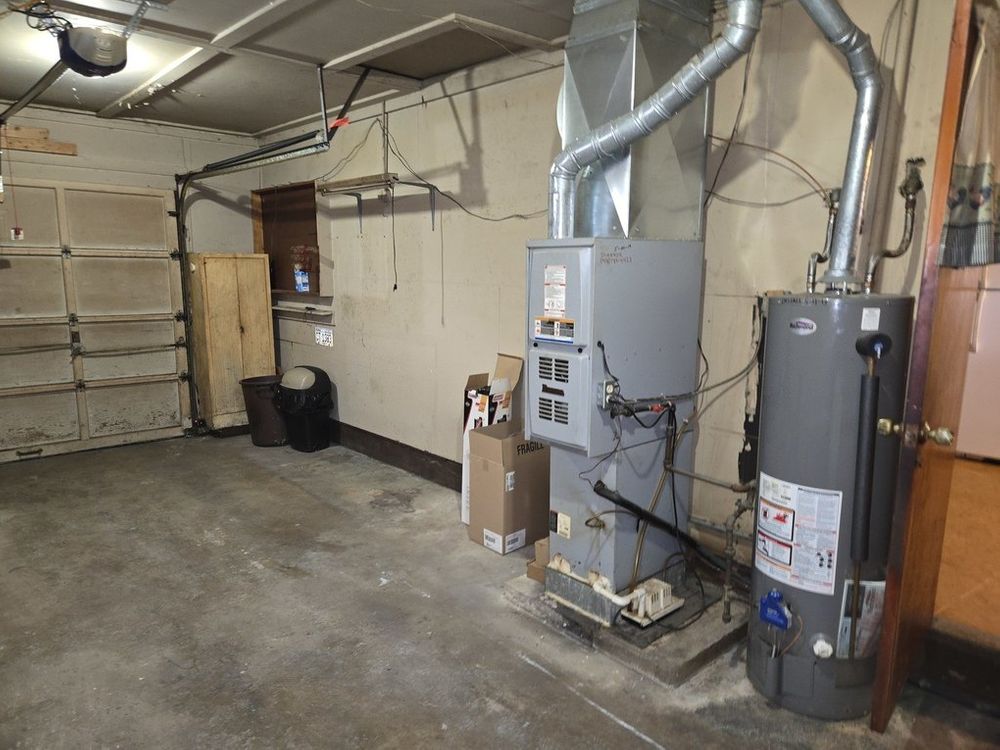
Property Description
Nice solid and move in ready ranch for a great price in West Markham. The roof was just replaced this year, and all new carpeting was installed. Most rooms are freshly painted as well. The home features a comfortable Living Room, eat in Kitchen and three bedrooms. The attached one-car garage also serves as the Laundry and Utility Room. With the attached garage, your back yard space is even nicer with mature maple trees. Ideally located for those in need of commuting to work with I-57, I-80, and I-294 within 1.5 miles, along with the Metra line in nearby Midlothian or Oak Forest.
| Purchase Price | $ 139,900 |
| Address | 15624 Lawndale Ave , Markham, 60428, IL |
| MLS® # | 12220451 |
| Listing Agent | Lenny Feil |
| Year Built | 1955 |
| Type | Singlefamily |
| Bedrooms | 3 |
| Bathrooms | 1 |

Property History
| Date | Price | Change | Event |
|---|---|---|---|
| 12/2/2024 | 139900 | Listed | |
| 3/22/1983 | 42000 | Sold |
Operating Analysis
Financial Analysis
Financing Overview
Long-term Cash Flow Forecast
Resale Analysis
Photos


Sign in to edit this report, add or compare properties. Don't have an acount? Sign up now!