{{ label }}


Real Estate Analysis


Property Report: 1311 Clearview Ave, Parma RENTAL
Property Report :
1311 Clearview Ave, Parma, OH 44134
Powered by
Real Estate Analysis
![]()
Created on: Apr 14, 2025
Author: Demo User
Company: Demo Realty LLC
Executive Summary
1311 Clearview Ave, Parma, OH 44134
Singlefamily: 3 bedrooms , 2 bathrooms
Year built: 1951, Size: 1656 SF
Investment strategy: Rental Property
Purchase Price$ 124,900
Rent$ 1,175/mo
Monthly Cash Flow$ 728
Cash on Cash Return34.97 %
Financial Analysis
| Cash on Cash Return | 34.97 % |
| Internal Rate of Return (IRR) | 25.15 % |
| Capitalization Rate | 6.99 % |
| Gross Rent Multiplier (GRM) | 8.86 |
| Debt-coverage Ratio (DCR) | 0.00 |
| Operating Expense Ratio (OER) | 31.17 % |
Financial Breakdown
| Purchase Price | $ 124,900 |
| Purchase Costs | $ 0 |
| Repair/Construction Costs | $ 0 |
| $ 124,900 | |
| Financing | $ 99,920 |
| $ 24,980 | |
| $ 24,980 | |
| $ 0 |
Operating Analysis
| Rent | $ 1,175/mo |
| Gross Operating Income (GOI) | $ 12,690 |
| Total Expenses | $ 3,955 |
| Net Operating Income (NOI) | $ 8,735 |
| Annual Debt Service | $ 0 |
| Cash Flow Before Taxes (CFBT) | $ 8,735 |
| Income Tax Liability | $ 2,551 |
| Cash Flow After Taxes (CFAT) | $ 6,184 |
Property Description
3 bedroom 2 bath Cape Cod in a quiet neighborhood with a one car detached garage. This house is perfect for a buyer looking to put their personal touches on it. Very close to I480/I77 for easy highway access and shopping is within walking distance. Come in quick and make this home yours!
| Purchase Price | $ 124,900 |
| Address | 1311 Clearview Ave , Parma, 44134, OH |
| MLS® # | 4302837 |
| Listing Agent | Michael Kaim Agent |
| Listing Broker | Berkshire Hathaway HomeServices Professional Realty |
| Year Built | 1951 |
| Type | Singlefamily |
| Size | 1656 SF |
| Bedrooms | 3 |
| Bathrooms | 2 |
Property History
| Date | Price | Change | Event |
|---|---|---|---|
| 1/22/2016 |
Operating Analysis
Financial Analysis
Financing Overview
Long-term Cash Flow Forecast
Resale Analysis
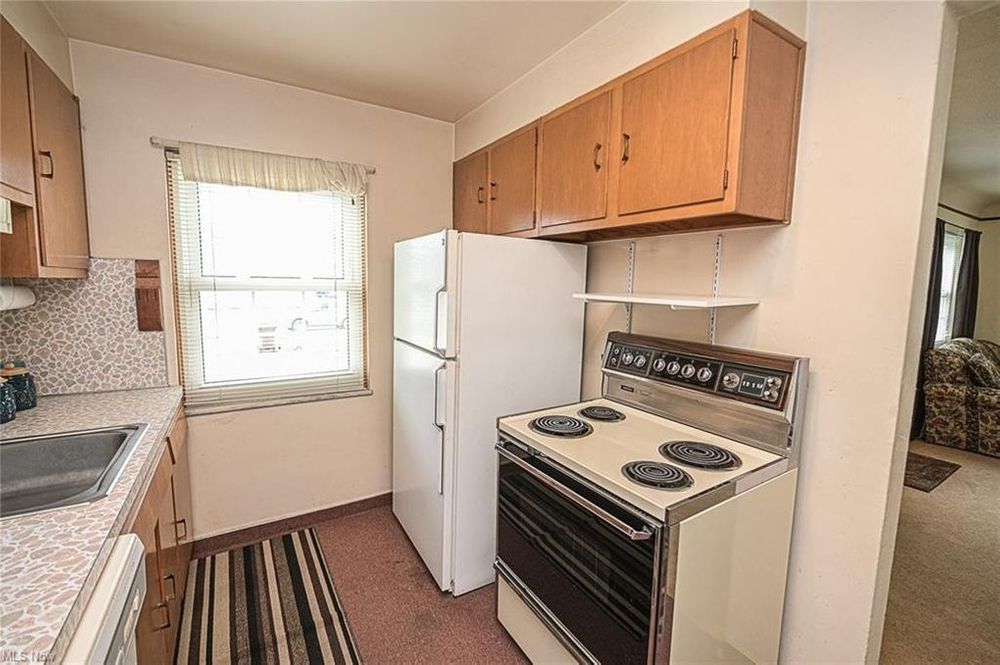
Photos
Sign in to edit this report, add or compare properties. Don't have an acount? Sign up now!