{{ label }}


Real Estate Analysis


Property Report: 1302 S State St, Lockport RENTAL
Property Report :
1302 S State St, Lockport, IL 60441
Powered by
Real Estate Analysis
![]()
Created on: Apr 14, 2025
Author: Robert Miller
Company: 11512 W. 183rd Pl, Suite SE
Executive Summary
1302 S State St, Lockport, IL 60441
Multifamily: 5 bedrooms , 3 bathrooms
Year built: 1882,
Investment strategy: Rental Property
Purchase Price$ 255,000
Rent$ 3,600/mo
Monthly Cash Flow$ 2,072
Cash on Cash Return8.81 %
Financial Analysis
| Cash on Cash Return | 8.81 % |
| Internal Rate of Return (IRR) | 11.00 % |
| Capitalization Rate | 7.31 % |
| Gross Rent Multiplier (GRM) | 7.87 |
| Debt-coverage Ratio (DCR) | 0.00 |
| Operating Expense Ratio (OER) | 38.12 % |
| After Repair Value | $ 340,000 |
| Profit/Equity From Rehab | $ 57,800 |
Financial Breakdown
| Purchase Price | $ 255,000 |
| Purchase Costs | $ 2,200 |
| Repair/Construction Costs | $ 25,000 |
| $ 282,200 | |
| Financing | $ 0 |
| $ 282,200 | |
| $ 0 | |
| $ 282,200 |
Operating Analysis
| Rent | $ 3,600/mo |
| Gross Operating Income (GOI) | $ 40,176 |
| Total Expenses | $ 15,314 |
| Net Operating Income (NOI) | $ 24,862 |
| Annual Debt Service | $ 0 |
| Cash Flow Before Taxes (CFBT) | $ 24,862 |
| Income Tax Liability | $ 4,361 |
| Cash Flow After Taxes (CFAT) | $ 20,501 |
Property Description
Fabulous investment opportunity! This 3 unit plus detached garage is located in a prime location in downtown Lockport close to shopping, dining & train! Main level unit offers 3 bedrooms & basement, while the (2) 2nd level apartments each offer 1 bedroom & 1 bath. Plenty of driveway parking plus garage could be rented for additional income. All units are currently occupied. Newer windows & roof. Highly rated school district.
| Purchase Price | $ 255,000 |
| Address | 1302 S State St , Lockport, 60441, IL |
| MLS® # | 11615181 |
| Listing Agent | Kim Wirtz |
| Listing Broker | CENTURY 21 Affiliated |
| Year Built | 1882 |
| Type | Multifamily |
| Number of Units | |
| Bedrooms | 5 |
| Bathrooms | 3 |
Property History
| Date | Price | Change | Event |
|---|---|---|---|
| 3/16/2017 | |||
| 11/17/2005 | |||
| 11/21/2001 | |||
| 5/22/2001 |
Operating Analysis
Financial Analysis
Financing Overview
Long-term Cash Flow Forecast
Resale Analysis
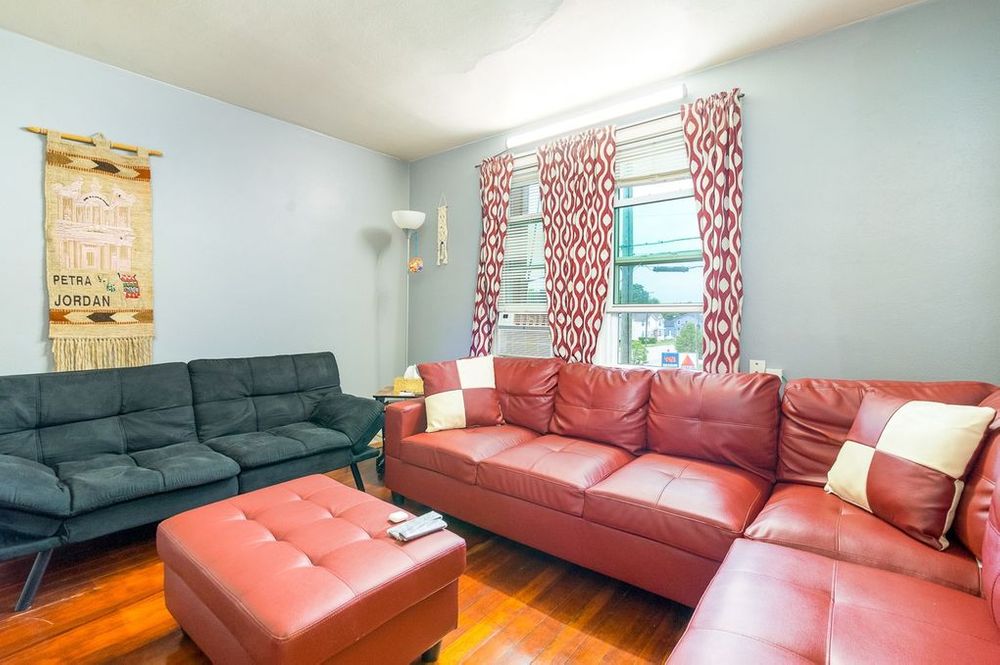
Photos
Sign in to edit this report, add or compare properties. Don't have an acount? Sign up now!