Property Report: 1126 W 340 S Unit 74, American Fork RENTAL
Property Report :
1126 W 340 S Unit 74, American Fork, UT 84003

Powered by
Real Estate Analysis
Created on: Apr 14, 2025
Author: Abby Brant & Brenda Horrocks
Executive Summary
1126 W 340 S Unit 74, American Fork, UT 84003
Condominium: 3 bedrooms , 3 bathrooms
Year built: 2022, Size: 1581 SF
Investment strategy: Rental Property

Financial Analysis
| Cash on Cash Return | 0.92 % |
| Internal Rate of Return (IRR) | 6.74 % |
| Capitalization Rate | 4.07 % |
| Gross Rent Multiplier (GRM) | 16.63 |
| Debt-coverage Ratio (DCR) | 1.13 |
| Operating Expense Ratio (OER) | 31.72 % |
Financial Breakdown
| Purchase Price | $ 418,990 |
| Purchase Costs | $ 4,189 |
| Repair/Construction Costs | $ 0 |
| $ 423,179 | |
| Financing | $ 209,495 |
| $ 213,684 | |
| $ 209,495 | |
| $ 4,189 |
Operating Analysis
| Rent | $ 2,100/mo |
| Gross Operating Income (GOI) | $ 24,948 |
| Total Expenses | $ 7,913 |
| Net Operating Income (NOI) | $ 17,035 |
| Annual Debt Service | $ 15,072 |
| Cash Flow Before Taxes (CFBT) | $ 1,963 |
| Income Tax Liability | $ -1,913 |
| Cash Flow After Taxes (CFAT) | $ 3,876 |
Property Description
ESTIMATED COMPLETION SEPTEMBER Beautiful 3-story Emery-E Townhome with 1-car garage, South of Pioneer Crossing in American Fork. Modern exterior style, flex/bedroom, and full bathroom on entry-level. Open family/kitchen layout, 9' ceiling on the 2nd level, standard kitchen layout, cabinets molding, stainless steel gas appliances, quartz countertop in kitchen and bathrooms, laminate flooring throughout the kitchen, dining, and family room. Two bedrooms including a bedroom suite with a private bath with a walk-in closet, and a junior suite with a 2nd full bathroom, and laundry closet on the third level. Use DHI Mortgage and receive $5, 000 toward closing costs. The actual home may differ in color, material, and/or options. Pictures are of a finished home of the same floor plan and the available home may contain different options, upgrades, and exterior color and/or elevation style. Square footage figures are provided as a courtesy estimate only and were obtained from building plans. No representation or warranties are made regarding school districts and assignments; please conduct your own investigation regarding current/future school boundaries.
| Purchase Price | $ 418,990 |
| Address | 1126 W 340 S Unit 74 , American Fork, 84003, UT |
| MLS® # | 1822066 |
| Listing Agent | Jeffrey Anderson |
| Listing Broker | D.R. Horton Inc. |
| Year Built | 2022 |
| Type | Condominium |
| Size | 1581 SF |
| Bedrooms | 3 |
| Bathrooms | 3 |

Operating Analysis
Financial Analysis
Financing Overview
Long-term Cash Flow Forecast
Resale Analysis
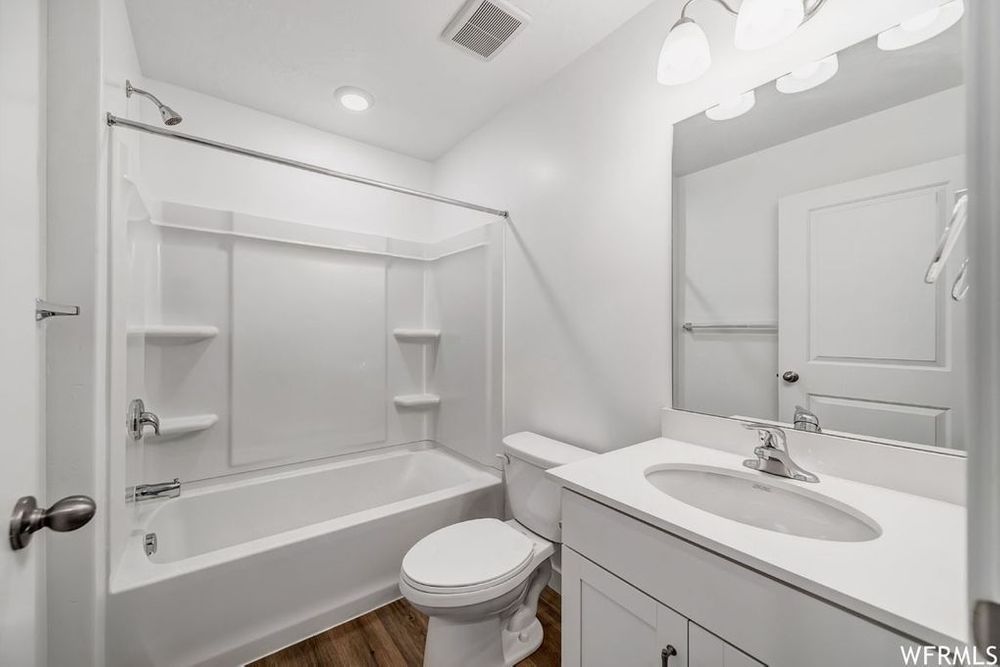
Photos


Sign in to edit this report, add or compare properties. Don't have an acount? Sign up now!