{{ label }}

Real Estate Analysis


Property Report: MILL RENTAL
Property Report :
MILL
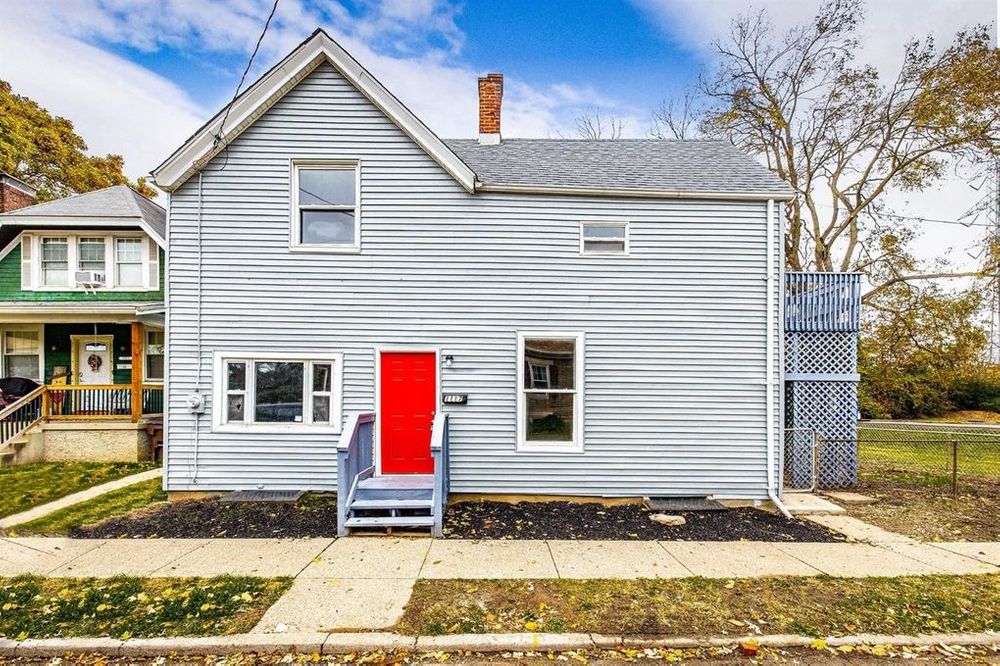
1117 Mill St, Reading, OH 45215
Powered by
Real Estate Analysis
![]()
Created on: Jul 29, 2025
Author: Lisa WIlliams
Company: Keller Williams Seven Hills
Executive Summary
1117 Mill St, Reading, OH 45215
Multifamily:
Year built: 1865, Size: 1638 SF
Investment strategy: Rental Property
Purchase Price$ 165,000
Rent$ 1,950/mo
Monthly Cash Flow$ 1,049
Cash on Cash Return36.50 %
Financial Analysis
| Cash on Cash Return | 36.50 % |
| Internal Rate of Return (IRR) | 34.79 % |
| Capitalization Rate | 12.08 % |
| Gross Rent Multiplier (GRM) | 7.05 |
| Debt-coverage Ratio (DCR) | 2.71 |
| Operating Expense Ratio (OER) | 12.16 % |
Financial Breakdown
| Purchase Price | $ 165,000 |
| Purchase Costs | $ 1,500 |
| Repair/Construction Costs | $ 0 |
| $ 166,500 | |
| Financing | $ 132,000 |
| $ 34,500 | |
| $ 33,000 | |
| $ 1,500 |
Operating Analysis
| Rent | $ 1,950/mo |
| Gross Operating Income (GOI) | $ 22,698 |
| Total Expenses | $ 2,760 |
| Net Operating Income (NOI) | $ 19,938 |
| Annual Debt Service | $ 7,345 |
| Cash Flow Before Taxes (CFBT) | $ 12,593 |
| Income Tax Liability | $ 2,554 |
| Cash Flow After Taxes (CFAT) | $ 10,039 |
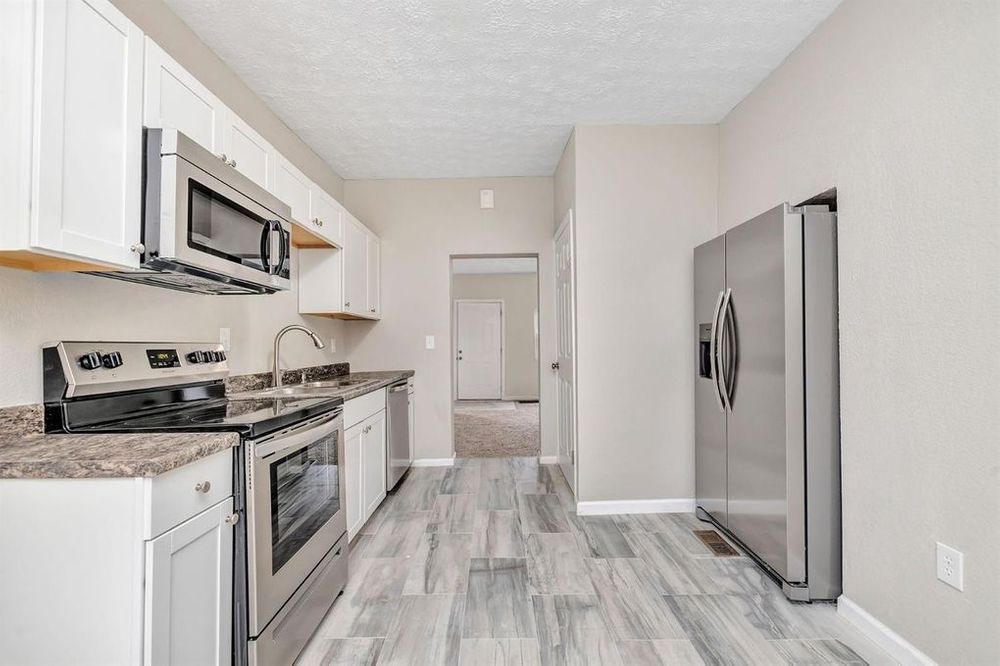
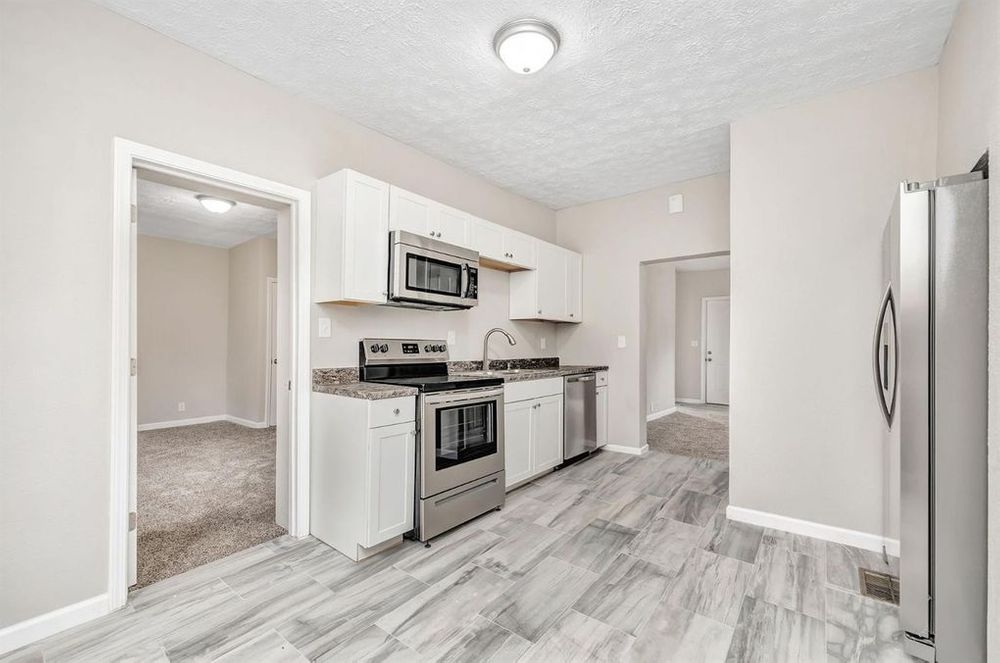
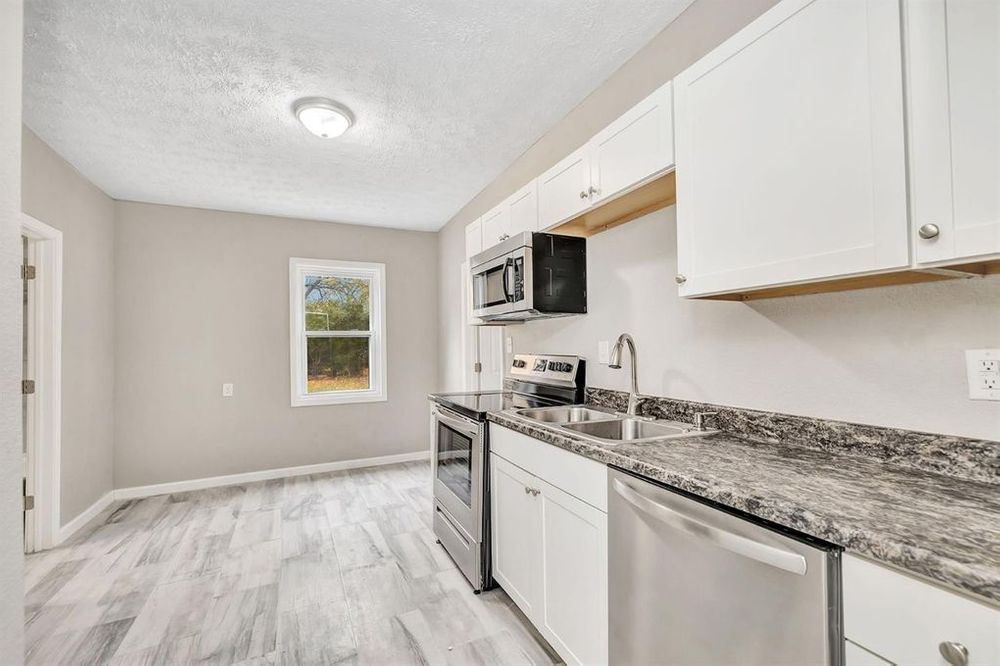
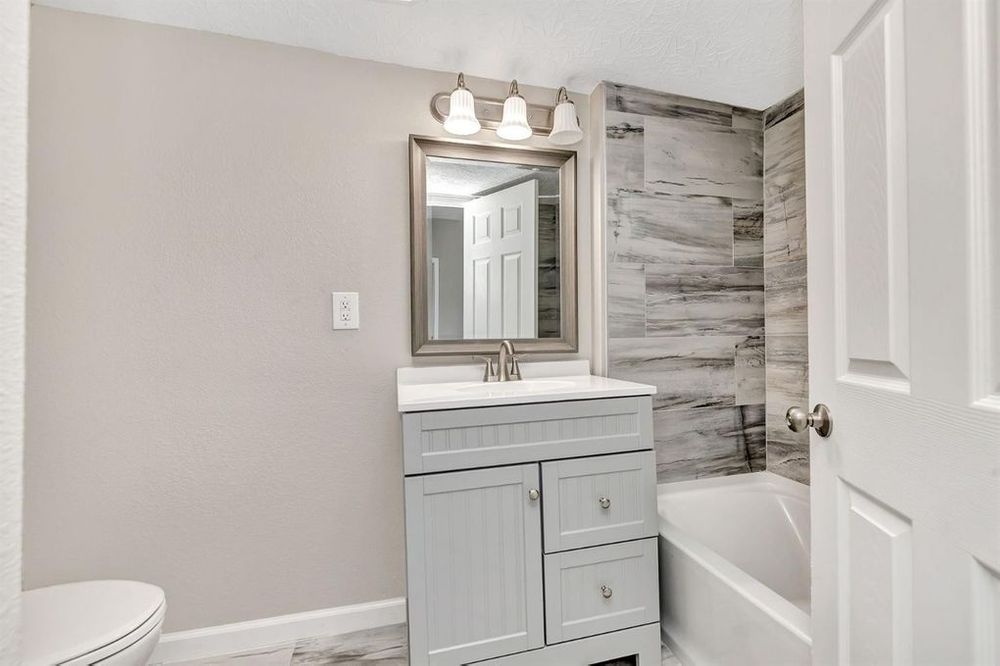
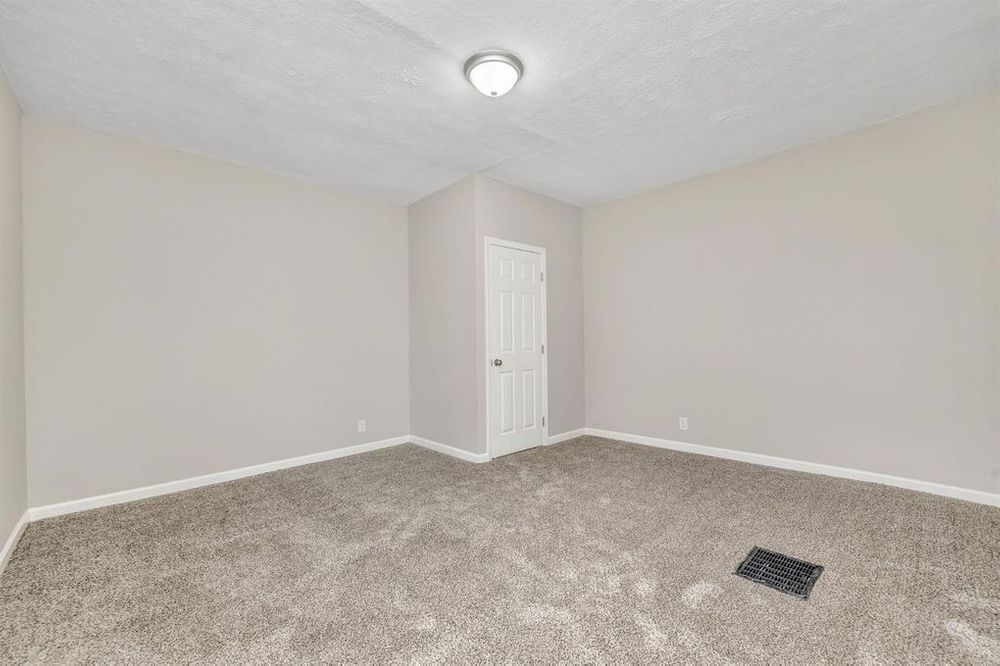
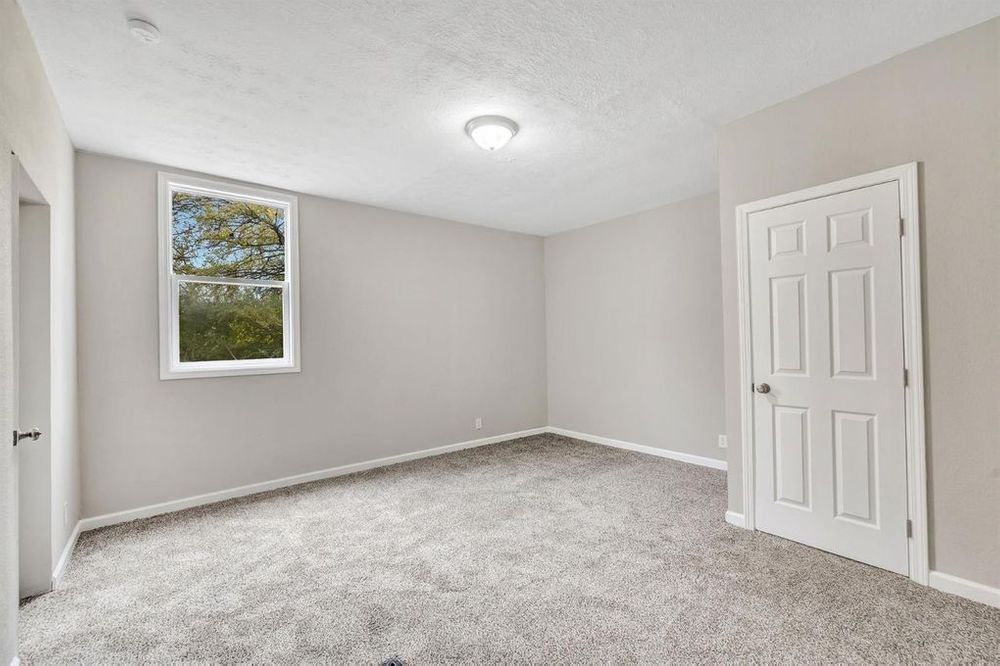
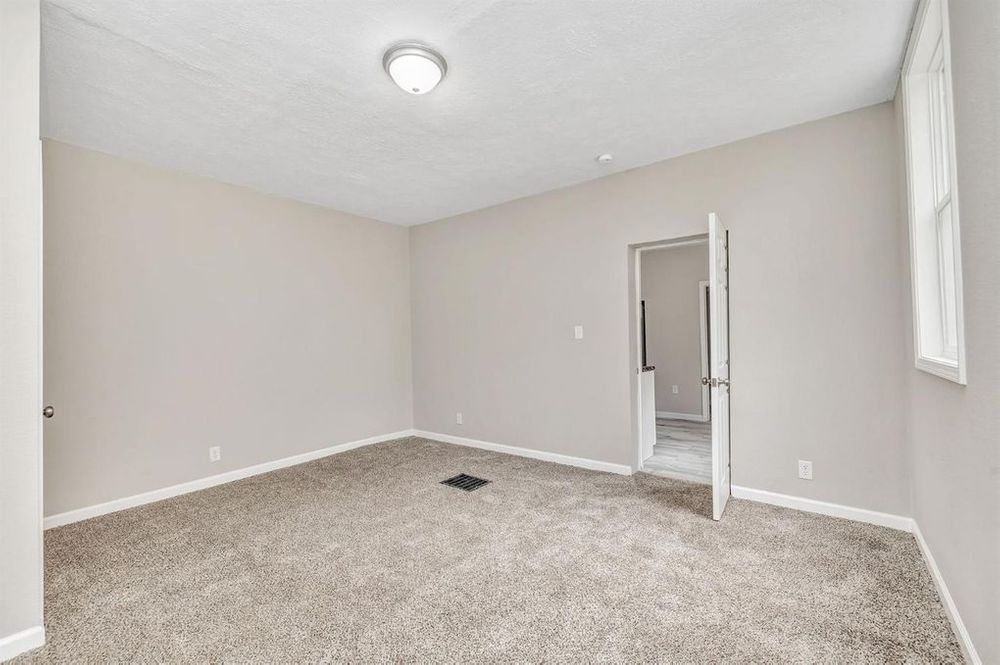
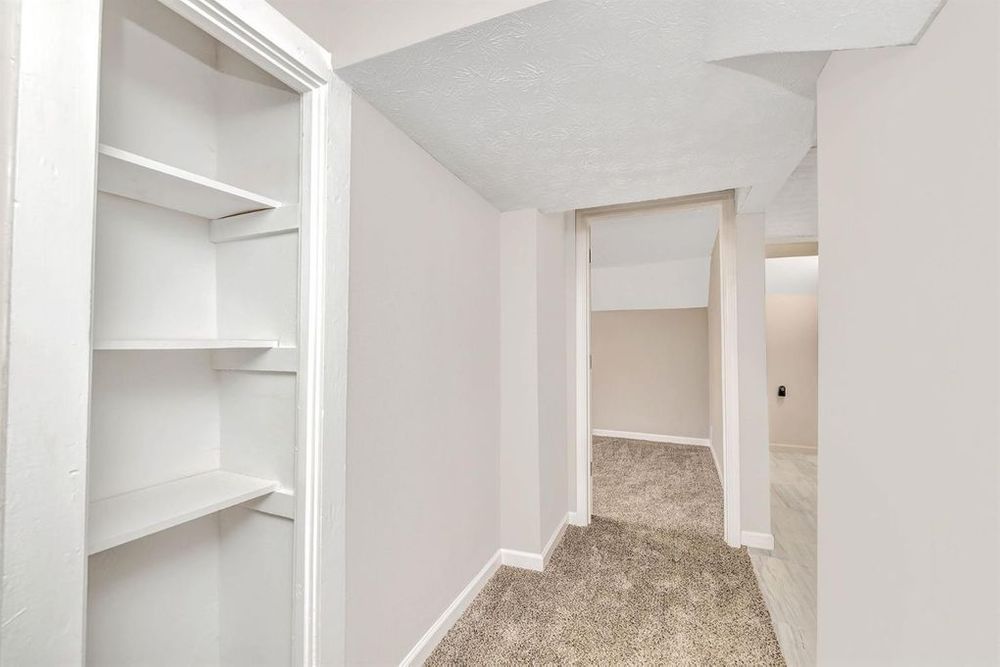
Property Description
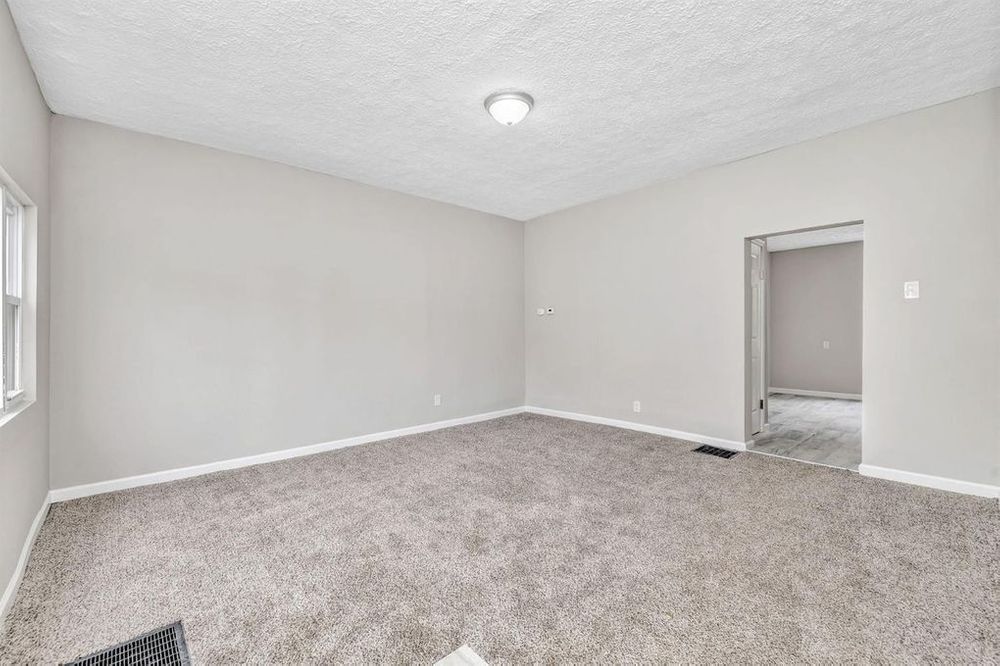
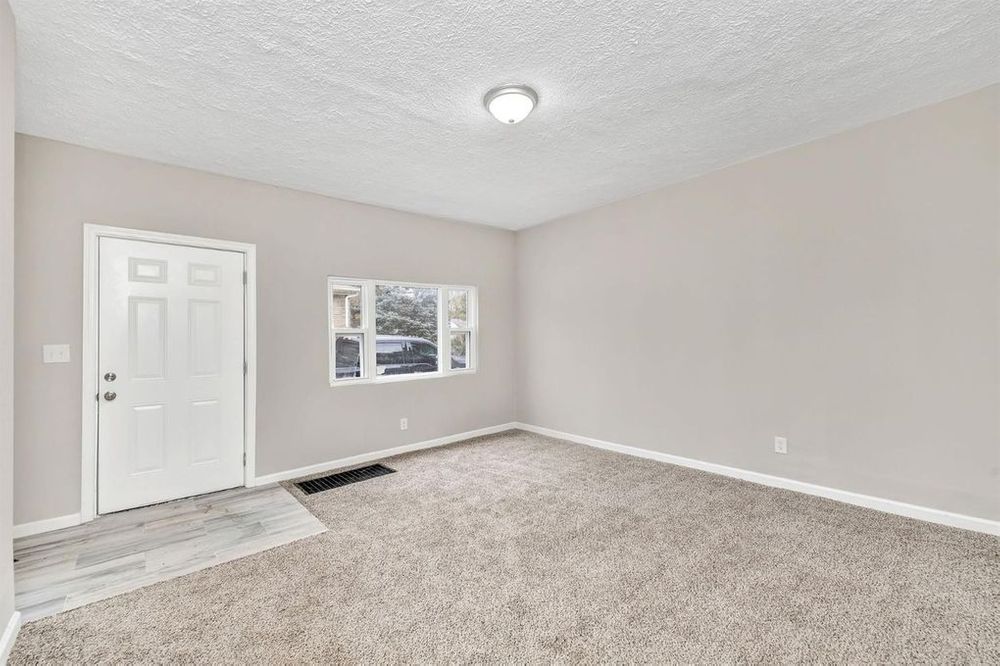
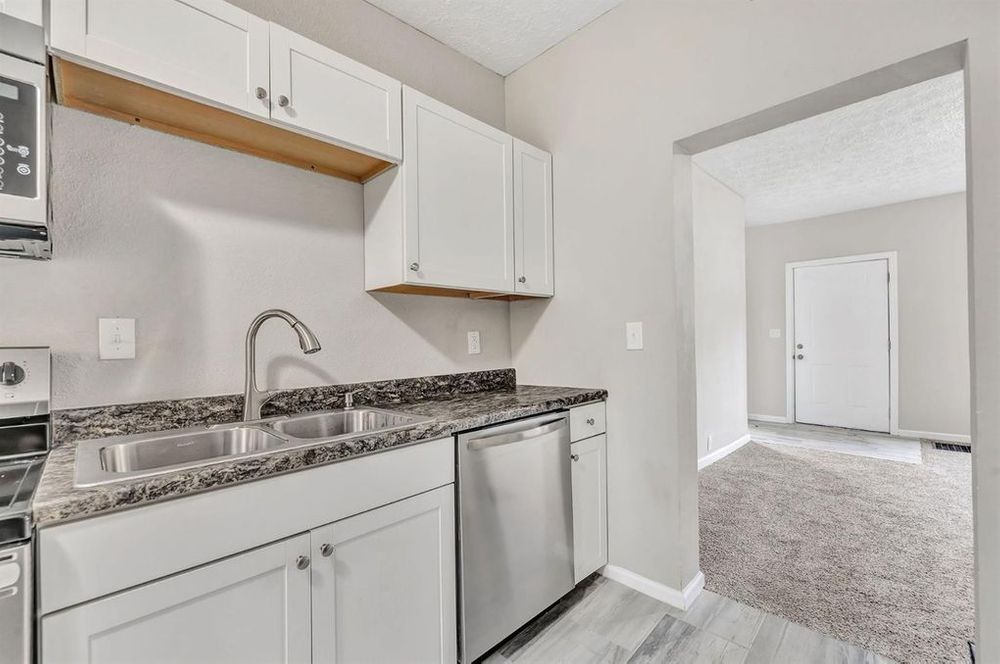
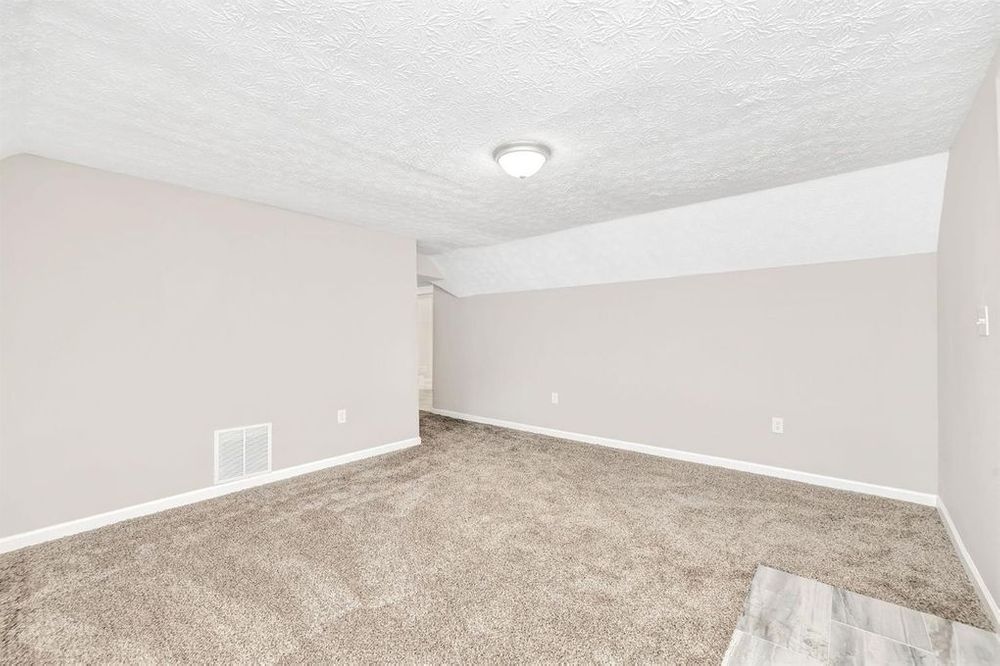
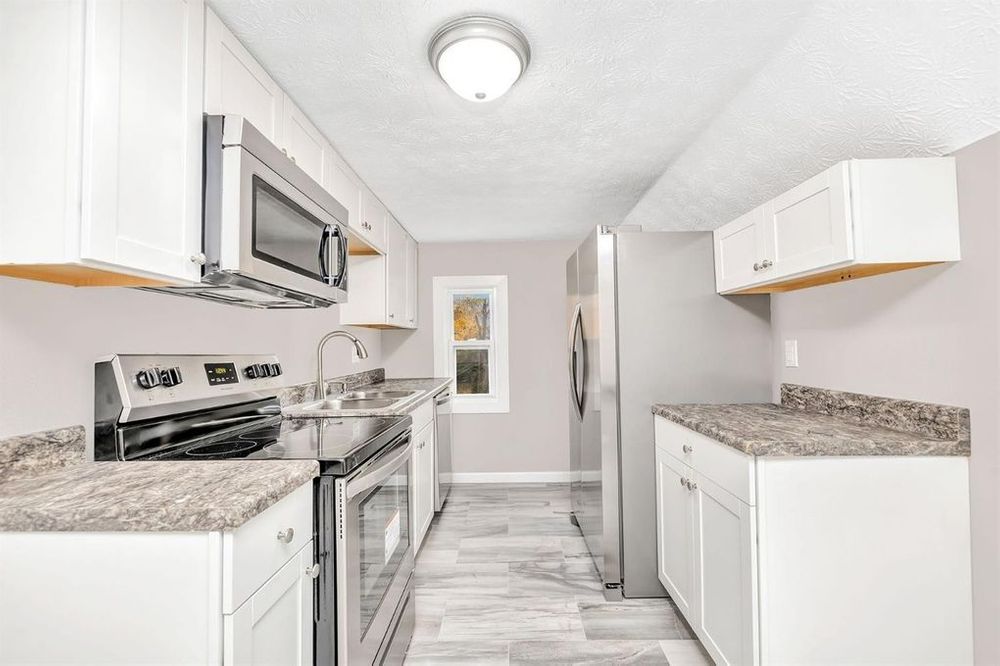
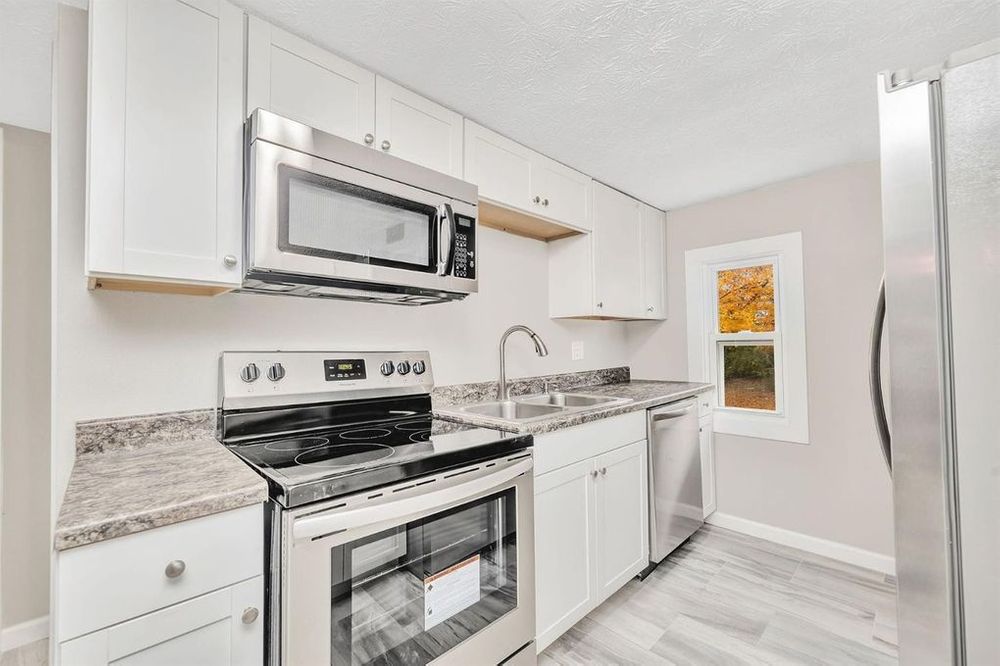
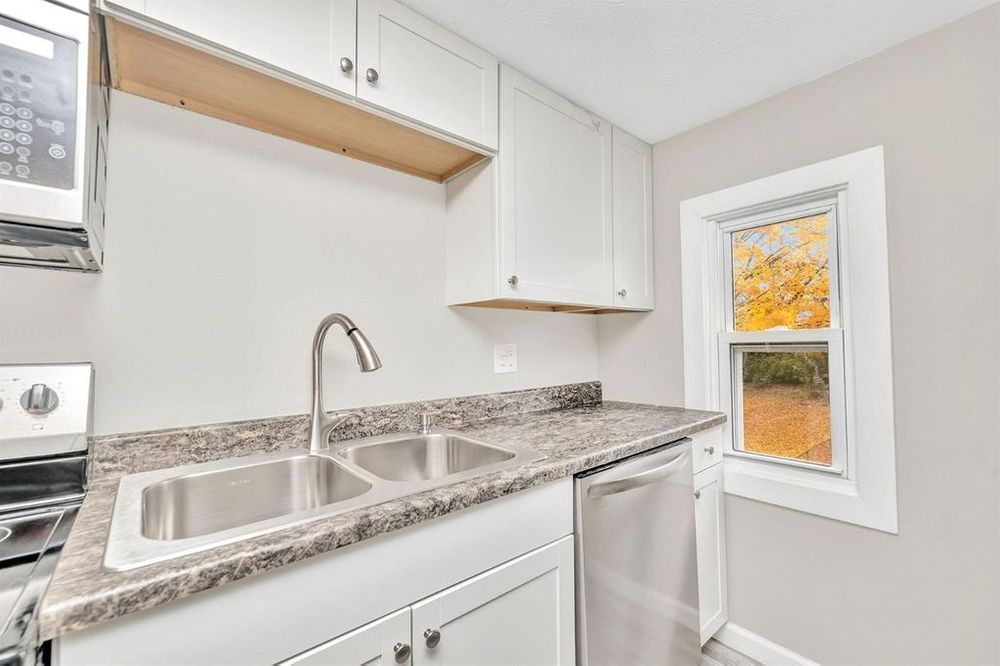
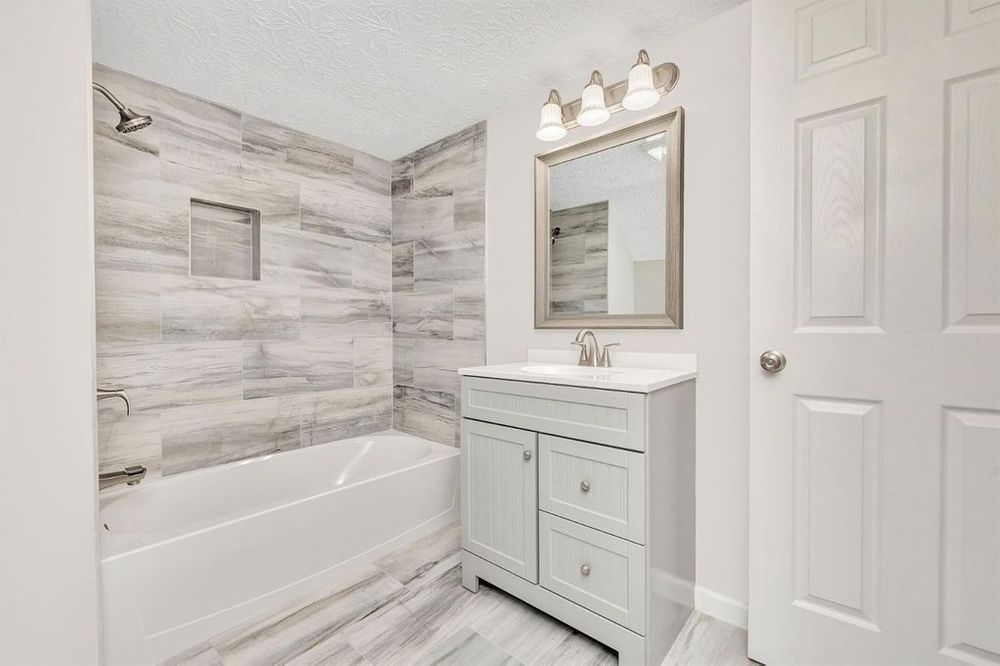
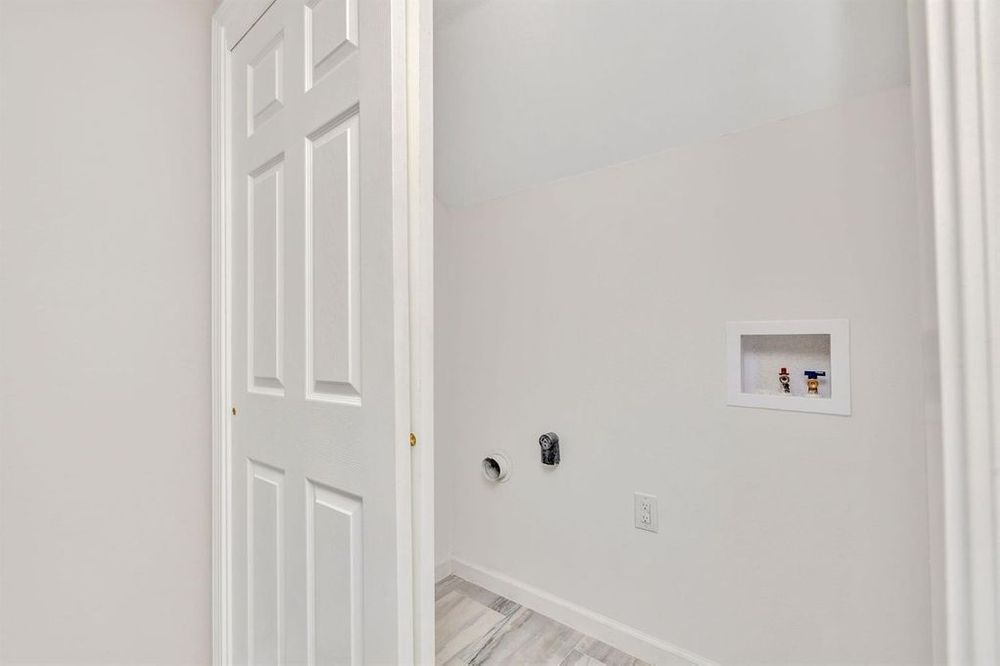
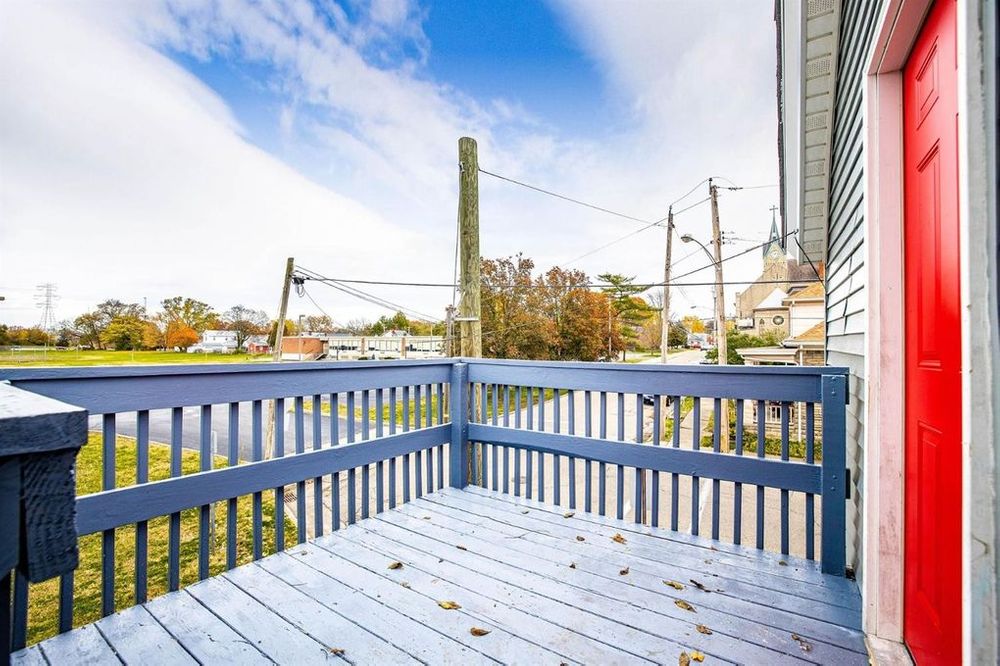
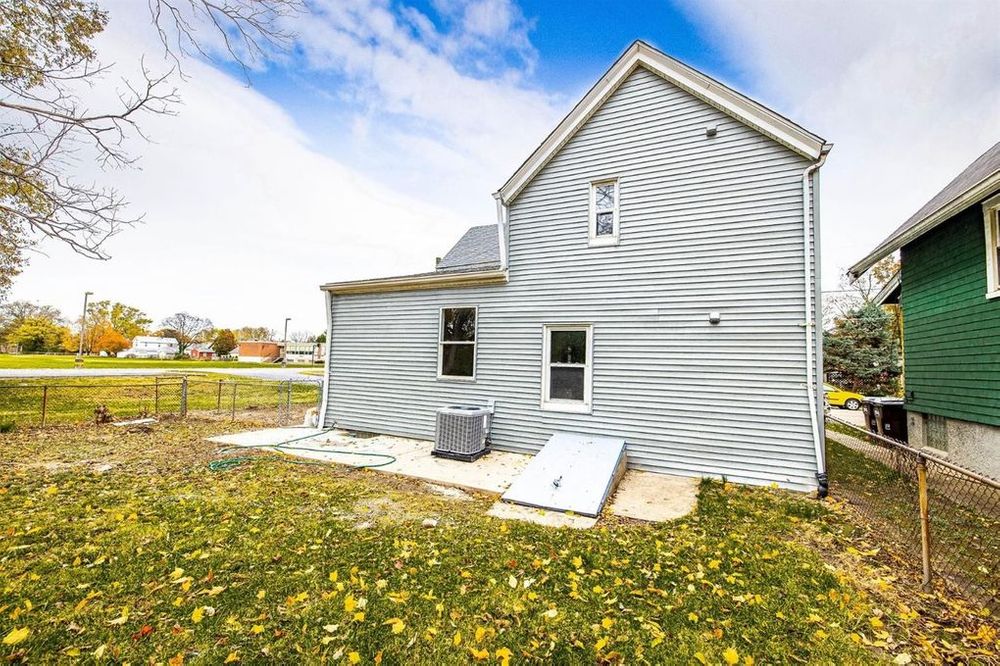
Beautiful 2 units duplex 2bedrooms & 1full unit & 1bedroom & 1Full Bathroom unit. Completely renovated & updated with New Carpet & flooring , Completely remodeled kitchen with stainless steel appliances , Professionally painted , Completely Updated Bathrooms , New light fixtures throughout, New roof, New water heater, New HVAC & AC units, New gutters, New deck.agent owned
| Purchase Price | $ 165,000 |
| Address | 1117 Mill St , Reading, 45215, OH |
| MLS® # | 1722601 |
| Listing Agent | Hossam Elsayed |
| Listing Broker | Emerald Home Advisors LLC |
| Year Built | 1865 |
| Type | Multifamily |
| Number of Units | |
| Size | 1638 SF |
Property History
| Date | Price | Change | Event |
|---|---|---|---|
| 5/27/2021 | |||
| 7/26/2000 | |||
| 3/5/1991 |
Operating Analysis
Financial Analysis
Financing Overview
Long-term Cash Flow Forecast
Resale Analysis
Photos
Sign in to edit this report, add or compare properties. Don't have an acount? Sign up now!