Keller Williams Seven Hills Realty
8040 Hosbrook Rd., Ste. 100
Cincinnati, OH 45236

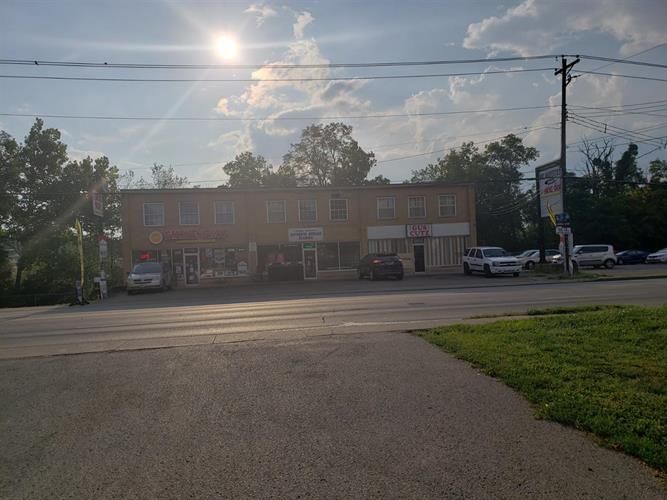
Property Report: 10045 Springfield Pike, Woodlawn RENTAL

Property Report :

10045 Springfield Pike, Woodlawn, OH 45215

Created on: Apr 16, 2025

Author: Jonathan Hardy

Company: Keller Williams Seven Hills Realty

10045 Springfield Pike, Woodlawn, OH 45215

Commercial: , 7 bathrooms

Year built: 1962, Size: 9610 SF

Investment strategy: Rental Property

Purchase Price$ 1,100,000
Rent$ 9,450/mo
Monthly Cash Flow$ 41
Cash on Cash Return0.17 %

Financial Analysis

Cash on Cash Return 0.17 %
Internal Rate of Return (IRR) 9.92 %
Capitalization Rate 5.15 %
Gross Rent Multiplier (GRM) 9.70
Debt-coverage Ratio (DCR) 1.01
Operating Expense Ratio (OER) 50.00 %

Financial Breakdown

Purchase Price $ 1,100,000
Purchase Costs $ 10,000
Repair/Construction Costs $ 0
Total Capital Needed
$ 1,110,000
Financing $ 825,000
Total Cash Needed
$ 285,000
Cash at Closing
$ 275,000
Cash During Rehab
$ 10,000

Operating Analysis

Rent $ 9,450/mo
Gross Operating Income (GOI) $ 113,400
Total Expenses $ 56,700
Net Operating Income (NOI) $ 56,700
Annual Debt Service $ 56,211
Cash Flow Before Taxes (CFBT) $ 489
Income Tax Liability $ -2,740
Cash Flow After Taxes (CFAT) $ 3,229

An Office/Retail asset for sale in Woodlawn! This asset comes with 10075 Springfield Pike as a package deal. Currently 95% occupied.Traffic count is great, parking lot has 25 spaces. 10% C.A.P Investment!

Purchase Price $ 1,100,000
Address 10045 Springfield Pike , Woodlawn, 45215, OH
MLS® # 1640203
Year Built 1962
Type Commercial
Size 9610 SF
Bathrooms 7

Property History

Date Price Change Event
5/25/2021 $1,500,000 7.14% Price Up
10/3/2019 $1,400,000 Listed Price
10045 Springfield Pike Woodlawn, OH 45215
  • Commercial

    Bldg type
  • 9,610

    SqFt
  • 7

    Baths
10045 Springfield Pike Woodlawn, OH 45215
  • $ 9,450

    Rent
  • Commercial

    Bldg type
  • 9,610

    SqFt
  • 7

    Baths

Your rent is reasonable for the area.

Average

$ 0 

Median

$ 0

25th %

$ 0

75th %

$ 0

It wasn't possible to load comps automatically for this address. You can add them manually below.

Property address Similarity Distance Beds Baths SqFt Date Listed Bldg type Rent Notes Edit

Comps selected: 0

Annual Property Operating Data

Incomes % of GOI
Gross Scheduled Income
$ 113,400    
Total Gross Income $ 113,400  
Vacancy loss
$ 0  
Gross Operating Income
$ 113,400 100.00 %
Expenses
50% rule $ 56,700 50.00 %
Total Expenses $ 56,700 50.00 %
Net Operating Income
$ 56,700 50.00 %
JavaScript chart by amCharts 3.20.13
JavaScript chart by amCharts 3.20.13CFBT Loan payment50% rule expenses

Cash Flow (Year 1)

Net Operating Income $ 56,700 50.00 %
Annual Debt Service $ 56,211 49.57 %
Cash Flow Before Taxes (CFBT)
$ 489 0.43 %
Income Tax Liability $ -2,740 -2.42 %
Cash Flow After Taxes (CFAT)
$ 3,229 2.85 %

Operating Ratios

Operating Expense Ratio
50.00 %
Break-Even Ratio
99.57 %

Financial Measures

Net Present Value
$ 368,628
Internal Rate of Return
9.92 %
Profitability Index
2.29
Annual Depreciation $ 22,564

Holding period of 20 years and discount rate of 5.00% were used for calculation of NPV and IRR. The rest of the financial measures are for the 1st year only and therefore don't provide such an exact information.

Investment Return Ratios

Cash on Cash Return
0.17 %
Return on Investment
11.75 %
Capitalization Rate
5.15 %
Gross Rental Yield
10.31 %
Gross Rent Multiplier
9.70
Financing
Down Payment $ 275,000
Conventional $ 825,000
Loan to Value Ratio
75.00 %
Loan to Cost Ratio
75.00 %
Debt Coverage Ratio 1.01
Conventional

Financing of: Purchase price ($ 1,100,000)

Type Amortized
Loan Amount $ 825,000
Down payment (25%) $ 275,000
Amortization 30 years
Interest Rate 5.50 %
Monthly Payment $ 4,684.26
JavaScript chart by amCharts 3.20.13
JavaScript chart by amCharts 3.20.13Down PaymentConventionalCash During Rehab
JavaScript chart by amCharts 3.20.13
JavaScript chart by amCharts 3.20.13Loan Principal Balance Equity: Principal Paid Equity: Cash Outlay Equity: Appreciation

This chart shows the process of accumulation of investor's equity. There is some equity created right at the beginning with the rehab/construction and later investor's equity is rising by paying off the principal of the loan and also by appreciation over the years. All the green parts is the cummulative equity belonging to the investor and the red part belongs to the lender.

Year 01234567891011121314151617181920
Operational Analysis
Gross Scheduled Income 0 113,400 115,668 117,981 120,341 122,748 125,203 127,707 130,261 132,866 135,524 138,234 140,999 143,819 146,695 149,629 152,621 155,674 158,787 161,963 165,202
Vacancy Loss 0 0 0 0 0 0 0 0 0 0 0 0 0 0 0 0 0 0 0 0 0
Gross Operating Income 0 113,400 115,668 117,981 120,341 122,748 125,203 127,707 130,261 132,866 135,524 138,234 140,999 143,819 146,695 149,629 152,621 155,674 158,787 161,963 165,202
Expenses 0 56,700 57,834 58,991 60,170 61,374 62,601 63,853 65,130 66,433 67,762 69,117 70,499 71,909 73,348 74,814 76,311 77,837 79,394 80,982 82,601
Net Operating Income 0 56,700 57,834 58,991 60,171 61,374 62,601 63,853 65,130 66,433 67,762 69,117 70,499 71,909 73,347 74,814 76,311 77,837 79,394 80,982 82,601
Loan Payment 0 56,211 56,211 56,211 56,211 56,211 56,211 56,211 56,211 56,211 56,211 56,211 56,211 56,211 56,211 56,211 56,211 56,211 56,211 56,211 56,211
Payment Interest Part 0 45,098 44,471 43,808 43,109 42,370 41,589 40,764 39,893 38,972 38,000 36,973 35,888 34,741 33,530 32,251 30,899 29,471 27,963 26,370 24,686
Payment Principal Part 0 11,113 11,740 12,403 13,102 13,841 14,622 15,447 16,318 17,239 18,211 19,238 20,323 21,470 22,681 23,960 25,312 26,740 28,248 29,841 31,525
Cash Flow
Repairs/Construction 0 0 0 0 0 0 0 0 0 0 0 0 0 0 0 0 0 0 0 0 0
Cash Flow Before Taxes -285,000 489 1,623 2,780 3,959 5,163 6,390 7,642 8,919 10,222 11,551 12,906 14,288 15,698 17,136 18,603 20,100 21,626 23,183 24,770 26,390
Depreciation 0 22,564 22,564 22,564 22,564 22,564 22,564 22,564 22,564 22,564 22,564 22,564 22,564 22,564 22,564 22,564 22,564 22,564 22,564 22,564 22,564
Taxes 0 -2,740 -2,300 -1,845 -1,376 -890 -388 131 668 1,224 1,799 2,395 3,012 3,651 4,313 5,000 5,712 6,450 7,217 8,012 8,838
Cash Flow After Taxes -285,000 3,229 3,923 4,625 5,335 6,053 6,778 7,511 8,251 8,998 9,751 10,511 11,276 12,047 12,823 13,603 14,388 15,175 15,966 16,758 17,552

Note: All amounts in the table above are in $

JavaScript chart by amCharts 3.20.13
JavaScript chart by amCharts 3.20.13GOINOICFBTCFAT

Resale Price Evaluation Methods

The property is sold after 20 years. Below is the resale price calculated using different methods.

Appreciation (3.00%) $ 1,986,722
Cap Rate (5.15%) & NOI $ 1,603,907
Gross Rent Multiplier $ 1,602,463

Sale Proceeds

Projected Selling Price $ 1,986,722
Costs of Sale (6.00%) $ 119,203
1. Loan Balance Payoff $ 431,624
Net Sale Proceeds Before Tax $ 1,435,894

In the resale analysis we do not include any calculation for taxes that might be owed on sale of the property. The tax laws for the resale are rather complex and subjected to frequent changes.

Net Assets and Yield

Net Assets
Sale Proceeds Before Tax $ 1,435,894
Investor Cash Outlay $ 285,000
Net Assets $ 1,150,894
Average Yield
Annual Net Assets $ 57,545
Average Cash Flow (After Taxes) $ 9,350
Average Annual Gain (After Taxes) $ 66,895
Average Annual Yield (After Taxes) 6.08 %
JavaScript chart by amCharts 3.20.13

This charts shows Net Present Value (NPV) when property is sold in various years, i.e. when sold in 5th year, the NPV is calculated from 5 years of Cash Flow (including the selling price) and this NPV is displayed in year 5. Optimal holding period can be estimated, using this method - when NPV is the highest. Please note that appreciation growth can change these numbers greatly. It sometimes makes sense to sell the property even before the end of the mortgage term.

Sign in to edit this report, add or compare properties. Don't have an acount? Sign up now!

BESbswy