Modern & Main Real Estate
350 E. 400 S
Salt Lake City, UT, 84111

Property Report: Helling Cir, Heber City RENTAL

Property Report :

Helling Cir, Heber City, UT 84032

Created on: Apr 14, 2025

Author: Modern & Main Real Estate

Company: Modern & Main Real Estate

Helling Cir, Heber City, UT 84032

Condominium: 3 bedrooms , 2 bathrooms

Year built: 2022, Size: 1585 SF

Investment strategy: Rental Property

Purchase Price$ 895,000
Rent$ 9,000/mo
Monthly Cash Flow$ 2,328
Cash on Cash Return11.78 %

Financial Analysis

Cash on Cash Return 11.78 %
Internal Rate of Return (IRR) 18.01 %
Capitalization Rate 8.81 %
Gross Rent Multiplier (GRM) 8.29
Debt-coverage Ratio (DCR) 1.55
Operating Expense Ratio (OER) 26.99 %

Financial Breakdown

Purchase Price $ 895,000
Purchase Costs $ 13,500
Repair/Construction Costs $ 0
Total Capital Needed
$ 908,500
Financing $ 671,250
Total Cash Needed
$ 237,250
Cash at Closing
$ 223,750
Cash During Rehab
$ 13,500

Operating Analysis

Rent $ 9,000/mo
Gross Operating Income (GOI) $ 108,000
Total Expenses $ 29,148
Net Operating Income (NOI) $ 78,852
Annual Debt Service $ 50,913
Cash Flow Before Taxes (CFBT) $ 27,939
Income Tax Liability $ 2,351
Cash Flow After Taxes (CFAT) $ 25,588

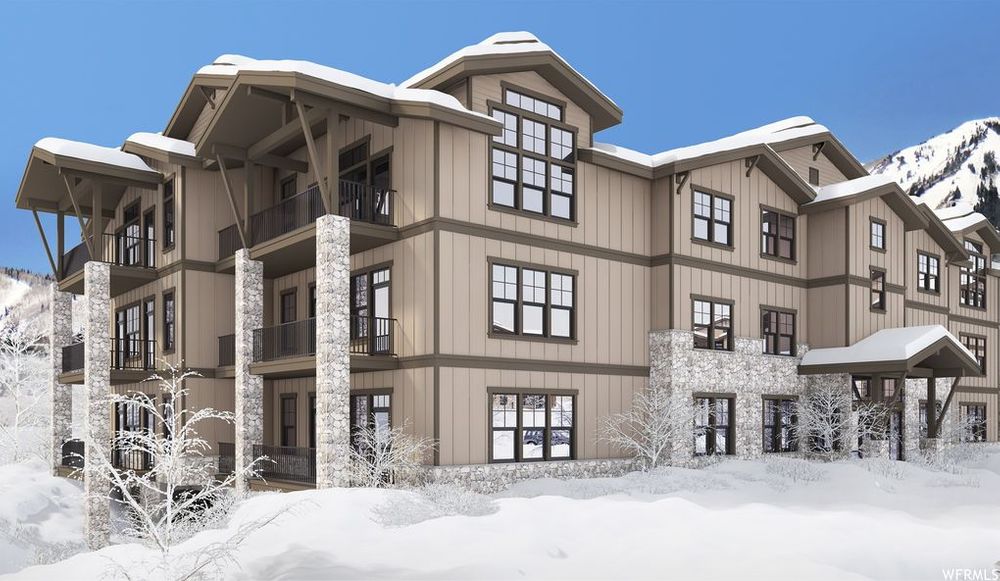
Mayflower Lakeside is located between Mayflower Mountain Resort's new base village and the Jordanelle Reservoir. This new development is 5 years in the making with beautiful contemporary design and finishes. There are 12 residences in this building and all are 3-bedrooms, situated on 1 of 3 elevator serviced floors, above secure underground assigned parking. They come ''standard'' with Viking appliances, and other finishes of a similar quality. Depending on the location in the building, their residences will have views of the Jordanelle, or views of the mountains, or both.

Purchase Price $ 895,000
Address Helling Cir , Heber City, 84032, UT
MLS® # 1821621
Listing Agent Mark Sletten
Listing Broker Engel & Volkers Park City
Year Built 2022
Type Condominium
Size 1585 SF
Bedrooms 3
Bathrooms 2

Annual Property Operating Data

Incomes % of GOI
Gross Scheduled Income
$ 108,000    
Total Gross Income $ 108,000  
Vacancy loss
$ 0  
Gross Operating Income
$ 108,000 100.00 %
Expenses
Property manager $ 16,200 15.00 %
Utilities $ 3,600 3.33 %
Insurance $ 1,000 0.93 %
Property tax $ 3,800 3.52 %
Association fees $ 4,548 4.21 %
Total Expenses $ 29,148 26.99 %
Net Operating Income
$ 78,852 73.01 %
JavaScript chart by amCharts 3.20.13
JavaScript chart by amCharts 3.20.13CFBT Loan paymentProperty managerUtilitiesInsuranceProperty taxAssociation fees

Cash Flow (Year 1)

Net Operating Income $ 78,852 73.01 %
Annual Debt Service $ 50,913 47.14 %
Cash Flow Before Taxes (CFBT)
$ 27,939 25.87 %
Income Tax Liability $ 2,351 2.18 %
Cash Flow After Taxes (CFAT)
$ 25,588 23.69 %

Operating Ratios

Operating Expense Ratio
26.99 %
Break-Even Ratio
74.13 %

Financial Measures

Net Present Value
$ 154,191
Internal Rate of Return
18.01 %
Profitability Index
1.65
Annual Depreciation $ 26,036

Holding period of 5 years and discount rate of 5.00% were used for calculation of NPV and IRR. The rest of the financial measures are for the 1st year only and therefore don't provide such an exact information.

Investment Return Ratios

Cash on Cash Return
11.78 %
Return on Investment
23.09 %
Capitalization Rate
8.81 %
Gross Rental Yield
12.07 %
Gross Rent Multiplier
8.29
Financing
Down Payment $ 223,750
Loan $ 671,250
Loan to Value Ratio
75.00 %
Loan to Cost Ratio
75.00 %
Debt Coverage Ratio 1.55
Loan

Financing of: Purchase price ($ 895,000)

Type Amortized
Loan Amount $ 671,250
Down payment (25%) $ 223,750
Amortization 30 years
Interest Rate 6.50 %
Monthly Payment $ 4,242.76
JavaScript chart by amCharts 3.20.13
JavaScript chart by amCharts 3.20.13Down Payment LoanCash During Rehab
JavaScript chart by amCharts 3.20.13
JavaScript chart by amCharts 3.20.13Loan Principal Balance Equity: Principal Paid Equity: Cash Outlay Equity: Appreciation

This chart shows the process of accumulation of investor's equity. There is some equity created right at the beginning with the rehab/construction and later investor's equity is rising by paying off the principal of the loan and also by appreciation over the years. All the green parts is the cummulative equity belonging to the investor and the red part belongs to the lender.

Year 012345
Operational Analysis
Gross Scheduled Income 0 108,000 110,160 112,363 114,610 116,903
Vacancy Loss 0 0 0 0 0 0
Gross Operating Income 0 108,000 110,160 112,363 114,610 116,903
Expenses 0 29,148 29,731 30,326 30,932 31,551
Net Operating Income 0 78,852 80,429 82,038 83,678 85,352
Loan Payment 0 50,913 50,913 50,913 50,913 50,913
Payment Interest Part 0 43,410 42,908 42,372 41,800 41,189
Payment Principal Part 0 7,503 8,005 8,541 9,113 9,724
Cash Flow
Repairs/Construction 0 0 0 0 0 0
Cash Flow Before Taxes -237,250 27,939 29,516 31,125 32,765 34,439
Depreciation 0 26,036 26,036 26,036 26,036 26,036
Taxes 0 2,351 2,871 3,407 3,961 4,532
Cash Flow After Taxes -237,250 25,588 26,645 27,717 28,805 29,907

Note: All amounts in the table above are in $

JavaScript chart by amCharts 3.20.13
JavaScript chart by amCharts 3.20.13GOINOICFBTCFAT

Resale Price Evaluation Methods

The property is sold after 5 years. Below is the resale price calculated using different methods.

Appreciation (3.00%) $ 1,037,550
Cap Rate (8.81%) & NOI $ 968,807
Gross Rent Multiplier $ 969,123

Sale Proceeds

Projected Selling Price $ 1,037,550
Costs of Sale (6.00%) $ 62,253
1. Loan Balance Payoff $ 628,364
Net Sale Proceeds Before Tax $ 346,933

In the resale analysis we do not include any calculation for taxes that might be owed on sale of the property. The tax laws for the resale are rather complex and subjected to frequent changes.

Net Assets and Yield

Net Assets
Sale Proceeds Before Tax $ 346,933
Investor Cash Outlay $ 237,250
Net Assets $ 109,683
Average Yield
Annual Net Assets $ 21,937
Average Cash Flow (After Taxes) $ 21,751
Average Annual Gain (After Taxes) $ 43,687
Average Annual Yield (After Taxes) 4.88 %
JavaScript chart by amCharts 3.20.13

This charts shows Net Present Value (NPV) when property is sold in various years, i.e. when sold in 5th year, the NPV is calculated from 5 years of Cash Flow (including the selling price) and this NPV is displayed in year 5. Optimal holding period can be estimated, using this method - when NPV is the highest. Please note that appreciation growth can change these numbers greatly. It sometimes makes sense to sell the property even before the end of the mortgage term.

Sign in to edit this report, add or compare properties. Don't have an acount? Sign up now!

BESbswy