{{ label }}

Real Estate Analysis


Property Report: 72 Park ( 1 habitacion ) RENTAL
Property Report :
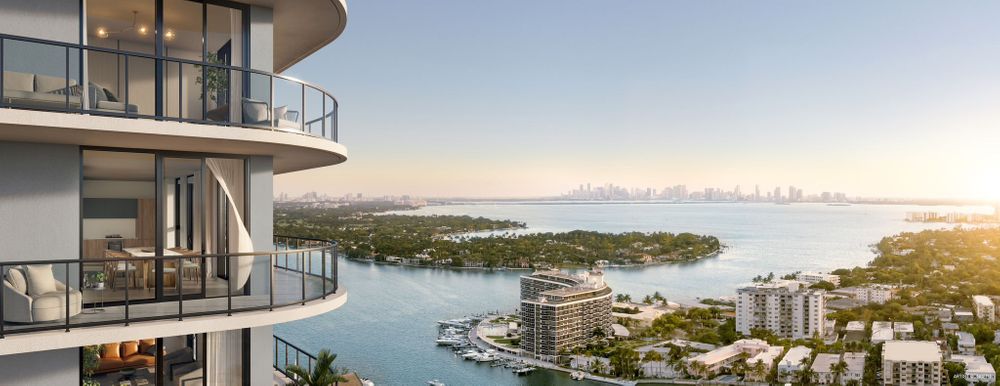
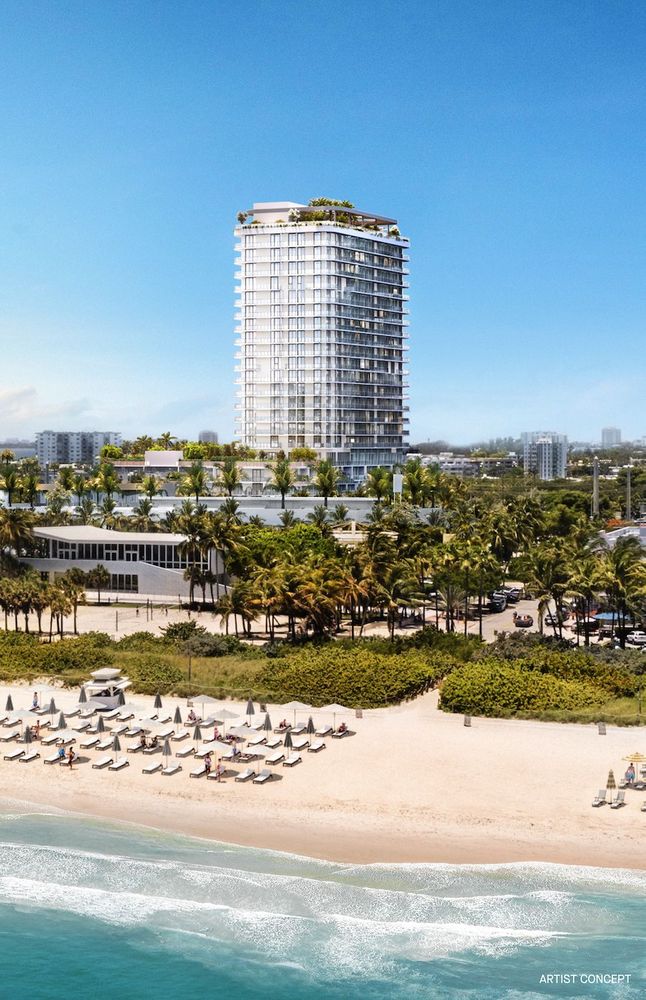
72 Park ( 1 habitacion )
72nd St, Miami Beach, FL 33141
Powered by
Real Estate Analysis
![]()
Created on: Jul 30, 2025
Author: Soraya Cedillo
Executive Summary
72nd St, Miami Beach, FL 33141
Investment strategy: Rental Property
Purchase Price$ 939,000
Rent$ 15,000/mo
Monthly Cash Flow$ 2,950
Cash on Cash Return8.99 %
Financial Analysis
| Cash on Cash Return | 8.99 % |
| Internal Rate of Return (IRR) | 10.90 % |
| Capitalization Rate | 8.56 % |
| Gross Rent Multiplier (GRM) | 5.22 |
| Debt-coverage Ratio (DCR) | 1.79 |
| Operating Expense Ratio (OER) | 40.46 % |
Financial Breakdown
| Purchase Price | $ 939,000 |
| Purchase Costs | $ 18,000 |
| Repair/Construction Costs | $ 0 |
| $ 957,000 | |
| Financing | $ 563,400 |
| $ 393,600 | |
| $ 375,600 | |
| $ 18,000 |
Operating Analysis
| Rent | $ 15,000/mo |
| Gross Operating Income (GOI) | $ 135,000 |
| Total Expenses | $ 54,624 |
| Net Operating Income (NOI) | $ 80,376 |
| Annual Debt Service | $ 44,980 |
| Cash Flow Before Taxes (CFBT) | $ 35,396 |
| Income Tax Liability | $ 3,451 |
| Cash Flow After Taxes (CFAT) | $ 31,945 |
Property Description
| Purchase Price | $ 939,000 |
| Address | 72nd St , Miami Beach, 33141, FL |
Operating Analysis
Financial Analysis
Financing Overview
Long-term Cash Flow Forecast
Resale Analysis
Photos
Sign in to edit this report, add or compare properties. Don't have an acount? Sign up now!